Volume 21, Number 1—January 2015
Dispatch
Oseltamivir-Resistant Influenza A(H1N1)pdm09 Viruses, United States, 2013–14
Margaret Okomo-Adhiambo, Alicia Fry, Su Su, Ha T. Nguyen, Anwar Abd Elal, Elizabeth Negron, Julie Hand, Rebecca J. Garten, John Barnes, Xu Xiyan, Julie M. Villanueva, Larisa Gubareva , and 2013–14 US Influenza Antiviral Working Group
Figure 1
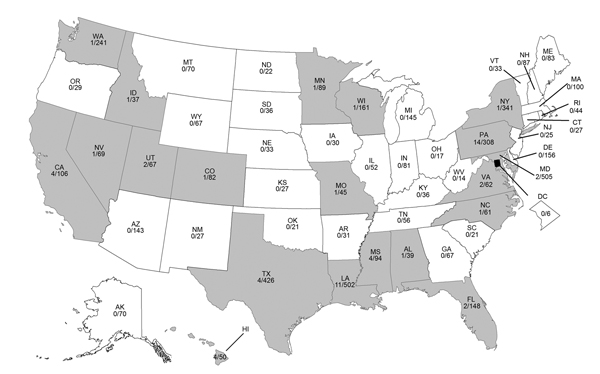
Figure 1. Geographic distribution of oseltamivir-resistant influenza A(H1N1)pdm09 viruses, United States, 2013–14. Gray indicates the presence of an oseltamivir-resistant virus. Number of oseltamivir-resistant A(H1N1pdm)09 viruses divided by total number of viruses tested is shown for each state. Oseltamivir-resistant A(H1N1)pdm09 viruses were significantly more prevalent in Louisiana (LA) (p = 0.04, by Fischer 2-sided exact test), Pennsylvania (PA) (p<0.001), Mississippi (MS) (p = 0.02), Hawaii (HI) (p = 0.02), and California (CA) (p = 0.03) than in all other states combined.
1Members of the 2013–14 US Antiviral Working Group are listed at the end of this article.
Page created: December 19, 2014
Page updated: December 19, 2014
Page reviewed: December 19, 2014
The conclusions, findings, and opinions expressed by authors contributing to this journal do not necessarily reflect the official position of the U.S. Department of Health and Human Services, the Public Health Service, the Centers for Disease Control and Prevention, or the authors' affiliated institutions. Use of trade names is for identification only and does not imply endorsement by any of the groups named above.