Volume 21, Number 11—November 2015
Research
Climatic Influences on Cryptococcus gattii Populations, Vancouver Island, Canada, 2002–2004
Cite This Article
Citation for Media
Abstract
Vancouver Island, Canada, reports the world’s highest incidence of Cryptococcus gattii infection among humans and animals. To identify key biophysical factors modulating environmental concentrations, we evaluated monthly concentrations of C. gatti in air, soil, and trees over a 3-year period. The 2 study datasets were repeatedly measured plots and newly sampled plots. We used hierarchical generalized linear and mixed effect models to determine associations. Climate systematically influenced C. gattii concentrations in all environmental media tested; in soil and on trees, concentrations decreased when temperatures were warmer. Wind may be a key process that transferred C. gattii from soil into air and onto trees. C. gattii results for tree and air samples were more likely to be positive during periods of higher solar radiation. These results improve the understanding of the places and periods with the greatest C. gattii colonization. Refined risk projections may help susceptible persons avoid activities that disturb the topsoil during relatively cool summer days.
Opportunistic fungal infections, such as those caused by Cryptococcus neoformans, are common causes of death and illness among persons with compromised immune systems. C. gattii is a related fungus that can cause serious illness. Specific genotypes (AFLP4/VGI, AFLP6/VGII) are isolated more commonly from immunocompetent persons, and other genotypes (AFLP5/VGIII, AFLP7/VGIV and AFLP10/VGIV) are isolated more commonly from immunocompromised persons. In 1999, a C. gattii genotype that had previously been reported in Brazil and Colombia was first documented on Vancouver Island in the province of British Columbia, Canada (1,2). The environmental genotypes in British Columbia are primarily VGIIa (AFLP6A, serotype B), VGIIb (AFLP6B, serotype B), and more rarely VGI (AFLP4, serotype B). In 2004, the fungus was identified in the Pacific Northwest region of the United States, and subsequently, C. gattii infections have been detected in 8 additional US states (3,4). Globally, the highest rates of C. gattii cryptococcosis incidence among humans and animals and the highest rates of positive environmental samples are reported from Vancouver Island (5,6). The natural habitat of this fungus seems to be a broad range of native trees and the surrounding soil (2,7,8). The epidemiology, nomenclature, historical climate, and population dynamics of C. gattii are summarized in the Technical Appendix and Table 1.
In general, previous studies examined seasonal versus short-term (e.g., monthly) C. gattii associations and primarily focused on C. gattii dynamics on trees versus in the air or soil. A limitation of studying seasonal C. gattii changes is that it is difficult to disentangle which biophysical conditions (temperature, sunlight, moisture, momentum) most strongly influence C. gattii concentrations. For example, which is the primary driver of airborne C. gattii levels in southern Australia: temperature, dryness, or both? More frequent C. gattii measurements and longitudinal statistics can help distinguish between competing processes. Most long-term studies documented C. gattii dynamics on trees; however, seasonality of C. gattii may differ in the soil and air (5). In particular, airborne C. gattii may have the most relevance for human health and deserves further attention. Furthermore, scrutinizing C. gattii dynamics in multiple media may provide additional support for conceptualizations of the C. gattii life cycle.
Our goal with this study was to determine the relative strength of associations between biophysical conditions and monthly C. gattii dynamics from the air, trees, and soil on Vancouver Island, Canada. The first research question examines specific plots from which repeated measurements were made during 2003–2004, and the second question examines only newly sampled C. gattii plots during 2002–2004. Based on environmental samples, these investigations were designed to provide insight into the periods with the greatest C. gattii area concentrations. This study expands on previous research in the area by studying changes over time, using representative weather stations, considering more biophysical conditions, and using statistics that control for autocorrelation.
Figure
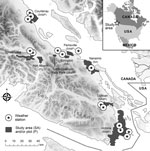
Figure. Areas on Vancouver Island, British Columbia, Canada, in which environmental samples were collected to determine Cryptococcus gattii concentrations during 2002–2004. Environment Canada provided weather information from 15 stations across the island.
Concentrations of C. gattii in the environmental soil, air, and trees were collected by previously described standardized methods (5; Technical Appendix). We evaluated 2 datasets of C. gattii VGIIb (AFLP6B, serotype B) previously collected by different sampling strategies: repeatedly measured and newly sampled. The first strategy sporadically resampled a geographic plot after a positive C. gattii sample was obtained for this site during 2003–2004. This dataset is similar to the permanently colonized sites analyzed in an ecologic habitat study (15). The definition of a plot refers to a specific tree, soil sample 2 meters from the tree base, and the surrounding air. Plots were initially selected with >4 more longitudinal samples. The second strategy analyzed only the first samples from a newly tested plot as analyzed by Kidd et al. (5). The sample plots were taken from 9 study areas (Figure). The study areas reported cases in humans, animals, or both or were in biogeoclimatic zones similar to areas with reported cases. Only plots from study areas visited on >3 occasions and from which >1 C. gattii–positive sample was obtained were included in the analysis. In each area, new plots were tested in 16%–41% of the study months. Newly sampled plots may reflect C. gattii dynamics across the broader study area.
The study examined a broad range of biophysical conditions that plausibly influence population dynamics of fungi in the phylum Basidiomycota. Environment Canada provided daily temperature and precipitation data from 15 weather stations in 7 study areas (http://climate.weatheroffice.gc.ca/Welcome_e.html) (Figure). The second-generation North American Land Data Assimilation System (NLDAS) provided specific humidity, shortwave solar radiation (0.3–3 μm), and wind speed across the domain. Wind speed and solar radiation were infrequently considered in previous studies. Shortwave radiation was converted into Z-scores (number of SDs away from the mean) to align the range of the independent variables and promote statistical convergence. NLDAS uses weather models to interpolate conditions between stations by using physical laws and processes. The spatial resolution of the gridded NLDAS dataset was ≈14 km2. Validation shows good agreement between the NLDAS variables used in this study and independent observations (16).
There is minimal research to support the selection of periods over which biophysical conditions most strongly influence C. gattii dynamics. This analysis broadly considered biophysical conditions over the previous and current day, previous week, and previous month (past 30 days). For each sampling date, C. gattii observations for each plot were aligned with the corresponding weather conditions of the surrounding study area.
Statistical Analyses
Long-term C. gattii studies may reanalyze data collected for different purposes, such as surveillance and detection. C. gattii was rarely sampled continuously from the same plots. More commonly, repeated measurements were sporadically taken from the same plots. For example, tree A might have been sampled in January–March and August–October, tree B in April–July and November–December, and tree C in April–October. Although no tree was continuously sampled throughout the year, standardizing and pooling the sporadic samples can collectively yield seasonal C. gattii information. The analysis maximized the information available from the sporadic samples by use of hierarchical generalized linear and mixed effect models (GLMMs) that control for repeated measurements and clustered sampling (17).
GLMMs were used to investigate association of weather conditions with monthly C. gattii CFU counts (soil, air) or C. gattii presence/absence (trees). Poisson GLMMs with a random effect for each study observation accounted for overdispersion for the soil and air samples. Logistic GLMMs were used to analyze the tree samples. The analysis was conducted in R version 2.15.3 with use of the LME4 package (http://www.R-project.org/). In the first analysis of longitudinal samples, hierarchical random effects controlled for repeated plot measurements and plots nested within study areas.
The random effect in the second analysis accounted for plots nested within study areas. Both analyses controlled for tree genus (cedar, fir, oak, maple, pine, and other). If C. gattii were observed <20 times in trees of a given genus, genera were further aggregated into families or lumped into the “other” category. To control for residual spatial autocorrelation, we considered latitude and longitude as candidate independent variables in the analysis. We also controlled for seasonality with fixed-effect indicator variables for winter (November–February), spring (March–May), summer (June–July), and fall (August–October). The GLMM results were reported when the postvariable selection model residuals were not significantly autocorrelated. Residual autocorrelation was tested by autocorrelation and partial autocorrelation functions that were adjusted for missing data.
Intuitively, the C. gattii levels for a given month may be strongly related to the previous month’s values. Monthly C. gattii samples may exhibit a more complex temporal correlation structure. If the GLMM residuals were significantly autocorrelated, we conducted the analysis on a reduced dataset. For the first analysis, the reduced dataset included plots sampled in sequential months from the plots with >4 longitudinal samples. For the second analysis, the reduced dataset included all first samples in a study area, provided that the study area was sampled in the previous month. Thus, the GLMM controlled for seasonality, plot, or study area–specific random effects, and first-order autoregressive terms for each plot (first analysis) or study area (second analysis). The autoregressive term was the natural logarithm of average C. gattii concentration plus 1 (soil, air) or proportion of positive C. gattii samples (tree) in the previous month. In the reduced dataset, study areas in which C. gattii were observed <20 times were lumped together in the “other area” category.
Because of the relationships among weather conditions, a forward stepwise variable selection procedure involving the Akaike information criterion was used to select the multiple variable models. After a weather variable entered the model, the selection procedure did not consider other temporal aggregations of the same variable. For example, if daily absolute humidity exhibited the most significant C. gattii association, weekly or monthly absolute humidity was not tested in the next stepwise iteration. There are minor to moderate differences in the magnitudes of weather conditions across the study area. The statistical results therefore reflect time periods and geographic areas in which weather systematically influences C. gattii levels. Weather conditions in the study area were not further standardized to retain the interpretability and biological plausibility of weather conditions for C. gattii population dynamics.
Plot Level
Table 2 summarizes the mean C. gattii concentrations and sample size for the soil and air samples and the proportion of positive tree swab samples. On a plot level (first analysis), weather systematically influenced soil and airborne C. gattii levels (Table 3). The soil results from the reduced dataset with plots sampled in sequential months that controlled autocorrelation are reported. The statistical model controlled for a west-to-east gradient of increasing C. gattii concentrations across Vancouver Island and for seasonality. Geographic areas and periods with cooler temperatures, lower wind speeds, or both corresponded to the highest C. gattii concentrations. Soil concentrations of C. gattii were often elevated in the study areas with the coolest temperatures (Parksville and Little Qualicum Falls Park). Average wind speeds were weakest in the study areas surrounding Courtenay and Errington. During October–April, area-averaged (≈14 km2) monthly wind speeds were <2 m/s.
Airborne C. gattii levels for a given month were not associated with those of the previous month. Therefore all plots sampled >4 times were included in the analysis. Similar to the trend for the soil samples, there was an increasing eastward trend of C. gattii across the island. Solar radiation intensity was positively associated with airborne C. gattii concentrations. The most daily solar radiation is received in the southerly areas (Victoria, Parksville, Duncan) and during May–August. Wind speeds exhibited a more complex, nonlinear relationship to airborne propagules. Moderate daily wind speeds (1.5–3 m/s) may be more likely than less windy days (<1.5 m/s) to entrain C. gattii propagules into the air. However, C. gattii concentrations were lower on very windy days than on relatively tranquil days. Temperature was not associated with airborne concentrations.
A tree with a positive C. gattii sample in a given month was more likely to be positive in the following month. Thus, results are reported from the reduced dataset of trees sampled in sequential months (Table 3). Detection of C. gattii in tree samples was not significantly associated with weather conditions. Within the study area, northerly regions were less likely to host C. gattii–positive trees.
Study Area Level
Random sampling of new environmental samples during 2002–2004 showed that at the study area level, weather was systematically associated with C. gattii in soil and trees (Table 4). Most of the air samples were collected in sequential months, and the small number of air samples from newly sampled plots precluded formal statistical analysis. Consistent with the plot level, concentrations of C. gattii in soil were significantly associated with concentrations the previous month. The results of the subset of samples from sequential months are reported. In agreement with the plot-level analyses, higher average temperatures were associated with lower C. gattii concentrations in a study area after controlling for seasonality. However, wind speed did not significantly influence concentrations in soil.
Of note, temperature, wind speed, and solar radiation strongly influenced C. gattii dynamics on trees at the study area but not the plot level. Across each study area, a higher proportion of positive tree swab samples from the previous month increased the chances of elucidating C. gattii in the current month. The weather relationships were largely consistent with the results from the other media (soil and air). As with the soil samples, geographic areas and periods with warmer temperatures were associated with reduced frequency of C. gattii isolation. Similar to the air samples, solar radiation and wind speed were positively associated with frequency of C. gattii isolation. C. gattii isolation was more likely in southern study areas and during May–August, which had the most solar radiation.
In British Columbia, Canada, C. gattii exhibits specialized habitat preferences. It thrives in the area of the Vancouver Island rain shadow (i.e., southeast coast of Vancouver Island and the southwest coast of mainland British Columbia), where winter temperatures are predominantly above freezing and summer temperatures are not too hot (15). In the analysis of resampled plots, weather conditions over the previous and current day most strongly influenced C. gattii concentrations. For the first C. gattii sample analysis, weekly and monthly weather exhibited the best-fitting associations with detection of C. gattii in tree swab samples. Granados and Castañeda suggested that conditions up to 15 days before sampling most strongly influence C. gattii concentrations (18).
Geographic areas and periods with elevated temperatures decreased isolation of C. gattii from tree samples and concentration in soil. The results are consistent with C. gattii serotype B in Colombia, where C. gattii was sampled from the detritus of trees of species with persistent and elevated C. gattii concentrations (Eucalyptus camaldulensis and Terminalia cattapa) (18). In that study, the greatest proportions of positive samples were also found during periods of lower temperatures. Similarly, an elevational transect study conducted at elevations of 300–3,000 m found that C. gattii concentrations were greater at high elevations with cold temperatures (12°C–18°C annual average temperatures) than in temperate and tropical regions (19). In the Vancouver Island study area, average annual temperatures in C. gattii–endemic areas were slightly cooler (9.8°C–11.4°C). Outbreaks of C. gattii infection in humans or animals in Western Australia, Mediterranean Europe, and North America have been characterized by dry summers or dry winters with warm but not hot monthly temperatures (<22°C) (20). Laboratory studies of the optimum growth rates for C. gattii and competitors have not been conducted. This knowledge might provide a stronger mechanistic interpretation of temperature associations. According to research of other Basidiomycota, temperature may influence the ecologic niche by regulating the rate of enzyme-catalyzed reactions (21).
The aversion of the C. gattii strain in British Columbia to higher temperatures may partially account for the difficulty detecting C. gattii in environmental samples in warmer neighboring regions. In general, the proportion of C. gattii–positive samples declines with increasing southerly distance from Vancouver Island and the Gulf Islands. Prevalence of C. gattii in new soil samples (9.6%) and trees (7.7%) on Vancouver Island is remarkably high (5). In Washington, USA, British Columbia’s neighbor to the south, C. gattii was recovered in 3.0% of air, soil, and tree samples (5). This trend continues farther to the south in Oregon, USA, where C. gattii was detected in 0–0.6% of tree swab samples (3,22). The caveat to this trend is that Oregon is host to a different combination of C. gattii strains (AFLP6A/VGIIa, AFLP6C/VGIIc) than are British Columbia and Washington (AFLP6A/VGIIa, AFLP6B/VGIIb).
To adapt to biophysical stressors such as temperature, nutrient stress, and radiation, Cryptococcus spp. produce melanin. Melanin may increase the integrity of C. neoformans cells and make them less susceptible than nonmelanized cells to temperature extremes (23). Nutrient stress (glucose and peptone) enhances the production of melanin in C. gattii VGI and VGII (24). In laboratory C. neoformans studies, melanin increases survival to UV-C but not UV-B radiation (25,26). In our study, periods with more solar radiation (sum of visible, UV, and near-infrared) seem to promote C. gattii in the air and trees. Research on C. gattii serotype C in Colombia documented a similar association with solar radiation (18). To further clarify the role of melanin for mediating environmental stressors, further laboratory studies of C. gattii genotypes are needed
The association between windy days and airborne C. gattii concentrations may have >1 interpretation. Very windy conditions may be strong enough to transport C. gattii away from the local air monitor. It is also possible that these periods coincide with depressed soil C. gattii concentrations when there are fewer propagules that can be mobilized. Also, the accuracy of the isokinetic air sampler decreases during periods with stronger wind speeds (27).
Collectively, the study results support common conceptualizations of the life cycle of C. gattii. Trees and the surrounding soil are permanently colonized and seem to act as C. gattii reservoirs. Wind may provide a key process for transferring C. gattii from the soil into the air and onto trees in the wider study area. Concentrations of C. gattii near the soil surface (0 to <15 cm depth) are greater than concentrations deeper (15–30 cm) in the soil (3). Moderate wind speeds may mobilize surface soil and increase local airborne C. gattii concentrations. Higher wind speeds may transport C. gattii from the soil to trees across the broader area. It is also possible that wind is simply a proxy that coincides with life stages in which propagules are more likely to disperse. C. gattii colonization seems to be transitory on many of the recently colonized substrates. C. gattii flexibly inhabits and colonizes the soil and specific trees during different seasons, which may decrease intraspecific competition.
The primary route of human C. gattii exposure is probably the inhalation of infectious propagules. In the study area, the fungus causes ≈25 clinically diagnosed human illnesses and 4 deaths per year (http://www.bccdc.ca/dis-cond/a-z/_c/CryptococcalDisease/Cryptococcus+gattii.html). According to our results, the highest airborne C. gattii concentrations occur during August–October on sunny days with moderately windy conditions. The greatest risk for exposure to C. gattii from the soil is during relatively cool June and July summer days. Although these associations are consistent, until more research provides information about the infectious dose for humans, the study results characterize the risk for exposure associated with environmental factors, rather than disease risk. Weather and airborne concentrations of C. gattii should be associated with human cryptococcosis incidence; however, onset of documented cryptococcosis cases in British Columbia does not vary by season or month (28,29). The temporal discrepancy may be masked by the long and variable incubation period of this pathogen. Host factors may be stronger predictors of developing disease risk (30). Nonetheless, refined risk projections may benefit susceptible humans and animals living in areas of marginal C. gattii transmission.
Dr. Uejio is an assistant professor at Florida State University in the Department of Geography and Program in Public Health. He studies how the physical environment influences human health and well-being.
Acknowledgments
We thank the British Columbia Cryptococcal Working Group for their environmental sampling, epidemiological, and laboratory diagnostic support. We acknowledge Micah B. Hahn and anonymous reviewers for constructive comments on previous manuscript drafts. We also thank Julie R. Harris and Benjamin J. Park for helping to build the interdisciplinary research team.
This work was supported by the National Center for Atmospheric Research/Centers for Disease Control and Prevention Fellowship Program and the Florida State University First Year Assistant Professor Program.
References
- Meyer W, Castaneda A, Jackson S, Huynh M, Castaneda E. IberoAmerican Cryptococcal Study Group. Molecular typing of IberoAmerican Cryptococcus neoformans isolates. Emerg Infect Dis. 2003;9:189–95. DOIPubMedGoogle Scholar
- Kidd SE, Hagen F, Tscharke RL, Huynh M, Bartlett KH, Fyfe M, A rare genotype of Cryptococcus gattii caused the cryptococcosis outbreak on Vancouver Island (British Columbia, Canada). [PubMed ]. Proc Natl Acad Sci U S A. 2004;101:17258–63. DOIPubMedGoogle Scholar
- MacDougall L, Kidd SE, Galanis E, Mak S, Leslie MJ, Cieslak PR, Spread of Cryptococcus gattii in British Columbia, Canada, and detection in the Pacific Northwest, USA. [PubMed ]. Emerg Infect Dis. 2007;13:42–50.PubMedGoogle Scholar
- Harris JR, Lockhart SR, Sondermeyer G, Vugia DJ, Crist MB, D’Angelo MT, Cryptococcus gattii infections in multiple states outside the US Pacific Northwest. Emerg Infect Dis. 2013;19:1620–6 .PubMedGoogle Scholar
- Kidd SE, Chow Y, Mak S, Bach PJ, Chen H, Hingston AO, Characterization of environmental sources of the human and animal pathogen Cryptococcus gattii in British Columbia, Canada, and the Pacific Northwest of the United States. Appl Environ Microbiol. 2007;73:1433–43 . DOIPubMedGoogle Scholar
- Lester SJ, Malik R, Bartlett KH, Duncan CG. Cryptococcosis: update and emergence of Cryptococcus gattii. Vet Clin Pathol. 2011;40:4–17. DOIPubMedGoogle Scholar
- Lazéra MS, Cavalcanti MA, Trilles L, Nishikawa MM, Wanke B. Cryptococcus neoformans var. gattii–evidence for a natural habitat related to decaying wood in a pottery tree hollow. Med Mycol. 1998;36:119–22 .PubMedGoogle Scholar
- Randhawa HS, Kowshik T, Chowdhary A, Preeti Sinha K, Khan ZU, Sun S, The expanding host tree species spectrum of Cryptococcus gattii and Cryptococcus neoformans and their isolations from surrounding soil in India. Med Mycol. 2008;46:823–33. DOIPubMedGoogle Scholar
- Granados DP, Castañeda E. Isolation and characterization of Cryptococcus neoformans varieties recovered from natural sources in Bogotá, Colombia, and study of ecological conditions in the area. Microb Ecol. 2005;49:282–90. DOIPubMedGoogle Scholar
- Granados DP, Castañeda E. Influence of climatic conditions on the isolation of members of the Cryptococcus neoformans species complex from trees in Colombia from 1992–2004. FEMS Yeast Res. 2006;6:636–44. DOIPubMedGoogle Scholar
- Randhawa HS, Kowshik T, Chowdhary A, Prakash A, Khan ZU, Xu J. Seasonal variations in the prevalence of Cryptococcus neoformans var. grubii and Cryptococcus gattii in decayed wood inside trunk hollows of diverse tree species in north-western India: A retrospective study. Med Mycol. 2011;49:320–3. DOIPubMedGoogle Scholar
- Bedi NG, Nawange SR, Singh SM, Naidu J, Kavishwar A. Seasonal prevalence of Cryptococcus neoformans var. grubii and Cryptococcus gattii inhabiting Eucalyptus terreticornis and Eucalyptus camaldulensis trees in Jabalpur City of Madhya Pradesh, Central India. J Mycol Med. 2012;22:341–7. DOIPubMedGoogle Scholar
- Montenegro H, Paula CR. Environmental isolation of Cryptococcus neoformans var. gattii and C. neoformans var. neoformans in the city of São Paulo, Brazil. Med Mycol. 2000;38:385–90. DOIPubMedGoogle Scholar
- Ellis DH, Pfeiffer TJ. Natural habitat of Cryptococcus neoformans var. gattii. J Clin Microbiol. 1990;28:1642–4 .PubMedGoogle Scholar
- Mak S, Klinkenberg B, Bartlett K, Fyfe M. Ecological niche modeling of Cryptococcus gattii in British Columbia, Canada. Environ Health Perspect. 2010;118:653–8. DOIPubMedGoogle Scholar
- Luo L, Robock A, Mitchell KE, Houser PR, Wood EF, Schaake JC, Validation of the North American Land Data Assimilation System (NLDAS) retrospective forcing over the Southern Great Plains. J Geophys Res. 2003;108:8843. DOIGoogle Scholar
- Brown H, Prescott R. Applied mixed models in medicine. 2nd ed. West Sussex (UK): John Wiley & Sons; 2006.
- Granados DP, Castañeda E. Influence of climatic conditions on the isolation of members of the Cryptococcus neoformans species complex from trees in Colombia from 1992–2004. FEMS Yeast Res. 2006;6:636–44. DOIPubMedGoogle Scholar
- Quintero E, Castañeda E, Ruiz A. Distribución ambiental de Cryptococcus neoformans en el departamento de cundinamarca-colombia. Rev Iberoam Micol. 2005;22:93–8. DOIPubMedGoogle Scholar
- Hagen F, Ceresini PC, Polacheck I, Ma H, van Nieuwerburgh F, Gabaldón T, Ancient dispersal of the human fungal pathogen Cryptococcus gattii from the amazon rainforest. PLoS ONE. 2013;8:e71148. DOIPubMedGoogle Scholar
- Magan N. Ecophysiology: impact of environment on growth, synthesis of compatible solutes and enzyme production. In: Boddy L, Frankland JC, van West P, editors. Ecology of saprotrophic Basidiomycetes. London: Elsevier; 2008. p. 63–78.
- Mortenson JA, Bartlett KH, Wilson RW, Lockhart SR. Detection of Cryptococcus gattii in selected urban parks of the Willamette Valley, Oregon. Mycopathologia. 2013;175:351–5. DOIPubMedGoogle Scholar
- Rosas AL, Casadevall A. Melanization affects susceptibility of Cryptococcus neoformans to heat and cold. FEMS Microbiol Lett. 1997;153:265–72. DOIPubMedGoogle Scholar
- Mistry D, Carter D, D’Souza Basseal J. Low nutrient eucalyptus wood chip agar: a semi-quantitative medium for assessing melanin production by Cryptococcus gattii. Aust Mycol. 2009;28:15–8 [cited 2015 Sep 2]. http://bugs.bio.usyd.edu.au/AustMycolSoc/Journal/Issues2009.html
- Wang Y, Casadevall A. Decreased susceptibility of melanized Cryptococcus neoformans to UV light. Appl Environ Microbiol. 1994;60:3864–6 .PubMedGoogle Scholar
- Schiave LA, Pedroso RS, Candido RC, Roberts DW, Braga GU. Variability in UVB tolerances of melanized and nonmelanized cells of Cryptococcus neoformans and C. laurentii. Photochem Photobiol. 2009;85:205–13. DOIPubMedGoogle Scholar
- Nicholson KW. Physical aspects of bioaerosol sampling and deposition. In: Cox CS, Wathes CM, editors. Bioaerosols handbook. 1st ed. Boca Raton (FL): CRC Press; 1995. p. 27–53.
- Galanis E, Macdougall L, Kidd S, Morshed M, and the British Columbia Cryptococcus gattii Working Group. Epidemiology of Cryptococcus gattii, British Columbia, Canada, 1999. –2007. Emerg Infect Dis. 2010;16:251–7. DOIPubMedGoogle Scholar
- Johannson KA, Huston SM, Mody CH, Davidson W. Cryptococcus gattii pneumonia. CMAJ. 2012;184:1387–90. DOIPubMedGoogle Scholar
- MacDougall L, Fyfe M. Emergence of Cryptococcus gattii in a novel environment provides clues to its incubation period. J Clin Microbiol. 2006;44:1851–2. DOIPubMedGoogle Scholar
Figure
Tables
Cite This ArticleTable of Contents – Volume 21, Number 11—November 2015
| EID Search Options |
|---|
|
|
|
|
|
|
Please use the form below to submit correspondence to the authors or contact them at the following address:
Christopher K. Uejio, Department of Geography, Rm 323, Bellamy Bldg, 113 Collegiate Loop, Florida State University, Tallahassee, FL 32306-2190, USA
Top