Skip directly to site content Skip directly to page options Skip directly to A-Z link Skip directly to A-Z link Skip directly to A-Z link
Volume 21, Number 4—April 2015
Letter

Enterovirus A71 Subgenotype B5, France, 2013

Audrey MirandComments to Author , Lucie Molet, Chervin Hassel, Hélène Peigue-Lafeuille, Flore Rozenberg, Jean-Luc Bailly, and Cécile Henquell
Author affiliations: Clermont Université, Clermont-Ferrand, France (A. Mirand, C. Hassel, H. Peigue-Lafeuille, J.-L. Bailly, C. Henquell); Centre National de Référence des Entérovirus-Parechovirus, Clermont-Ferrand (A. Mirand, H. Peigue-Lafeuille, J.-L. Bailly, C. Henquell); Hôpital Cochin, Paris, France (L. Molet, F. Rozenberg); Université Paris Descartes, Paris (L. Molet, F. Rozenberg)

Main Article

Figure

Phylogeny of enterovirus A71 (EV-A71) subgenogroups B4 and B5 inferred with 274 partial 1D gene sequences, France. Black diamond indicates strain PAR024103_FRA13 from this study. The phylogenetic relationships were inferred following a Bayesian method by using a relaxed molecular clock model with an uncorrelated exponential distribution of evolution rates estimated with a general time reversible substitution model and a Bayesian skyline plot as a population model (BEAST version 1.7.5; http://bea

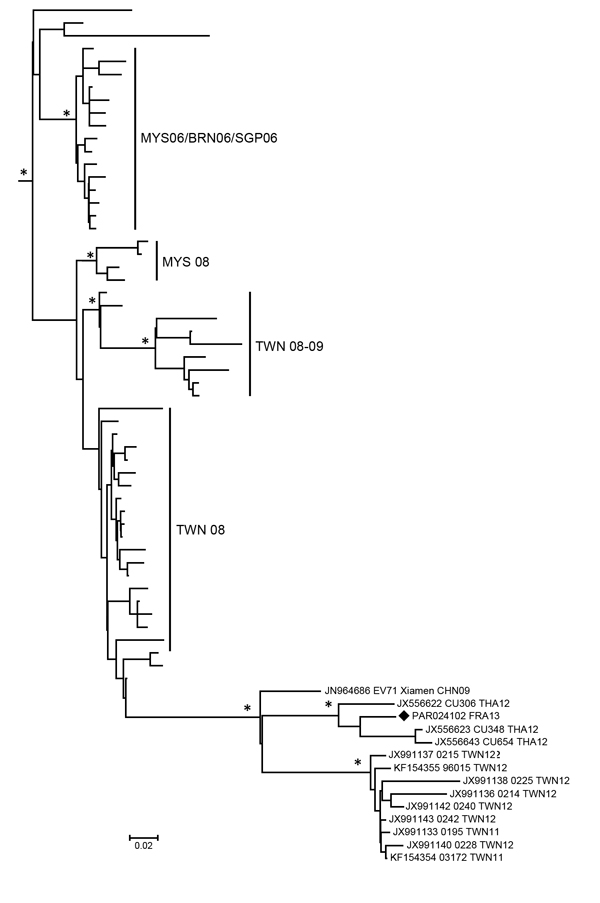
Figure. Phylogeny of enterovirus A71 (EV-A71) subgenogroups B4 and B5 inferred with 274 partial 1D gene sequences, France. Black diamond indicates strain PAR024103_FRA13 from this study. The phylogenetic relationships were inferred following a Bayesian method by using a relaxed molecular clock model with an uncorrelated exponential distribution of evolution rates estimated with a general time reversible substitution model and a Bayesian skyline plot as a population model (BEAST version 1.7.5; http://beast.bio.ed.ac.uk/). Sequences were 319 bp. For clarity, only a subtree of EV-A71 B5 sequences is shown, and taxon names are not included. Asterisks indicate nodes with posterior probability density values >0.90. Geographic origins and time of isolation of strains are indicated by the International Organization of Standardization code abbreviation followed by the year of isolation. Scale bar indicates nucleotide substitutions per site.

Main Article

Page created: March 17, 2015
Page updated: March 17, 2015
Page reviewed: March 17, 2015
The conclusions, findings, and opinions expressed by authors contributing to this journal do not necessarily reflect the official position of the U.S. Department of Health and Human Services, the Public Health Service, the Centers for Disease Control and Prevention, or the authors' affiliated institutions. Use of trade names is for identification only and does not imply endorsement by any of the groups named above.
file_external