Volume 22, Number 11—November 2016
Research
Epidemiology of La Crosse Virus Emergence, Appalachia Region, United States
Sharon Bewick , Folashade Agusto, Justin M. Calabrese, Ephantus J. Muturi, and William F. Fagan
Figure 4
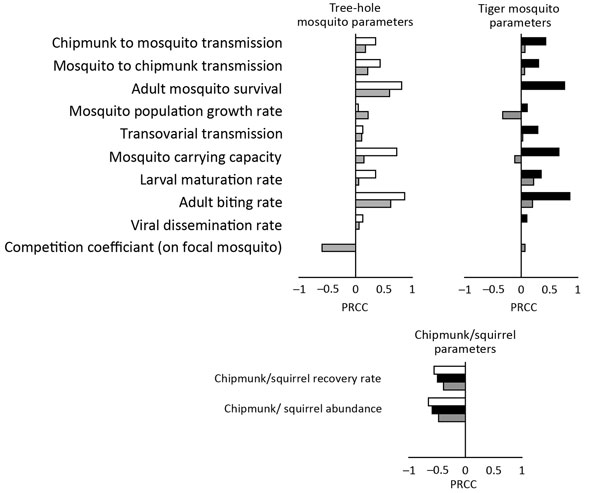
Figure 4. Partial rank correlation coefficients (PRCCs) showing the effect of each model parameter of La Crosse virus transmission on the basic reproduction number (R0) in the tree-hole model (white), tiger model (black), and tree-hole/tiger model (gray). Positive PRCC values indicate that R0 is positively correlated with a specific parameter, whereas negative PRCC values indicate the opposite. For specific PRCC values and significance, see Latin Hypercube Sampling and PRCC, at http://www.clfs.umd.edu/biology/faganlab/disease-ecology.html.
Page created: October 18, 2016
Page updated: October 18, 2016
Page reviewed: October 18, 2016
The conclusions, findings, and opinions expressed by authors contributing to this journal do not necessarily reflect the official position of the U.S. Department of Health and Human Services, the Public Health Service, the Centers for Disease Control and Prevention, or the authors' affiliated institutions. Use of trade names is for identification only and does not imply endorsement by any of the groups named above.