Volume 22, Number 6—June 2016
CME ACTIVITY - Synopsis
Human Infection with Influenza A(H7N9) Virus during 3 Major Epidemic Waves, China, 2013–2015
Peng Wu1, Zhibin Peng1, Vicky J. Fang, Luzhao Feng, Tim K. Tsang, Hui Jiang, Eric H.Y. Lau, Juan Yang, Jiandong Zheng, Ying Qin, Qiao Sun, Gabriel M. Leung, Sheng Wei , and Benjamin J. Cowling
Figure 4
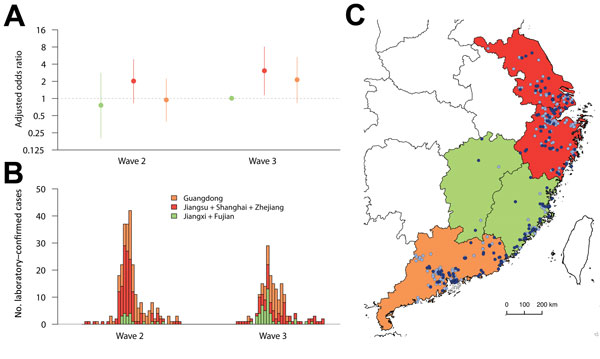
Figure 4. Comparison of risk for death among hospitalized patients with laboratory-confirmed influenza A(H7N9) virus infection detected in 3 areas of China where circulating influenza A(H7N9) viruses might belong to distinct genetic clades, 2013–2015. A) Odds ratios for death, adjusted for age, sex, patient’s residence, underlying medical conditions, and delay from onset to hospital admission; B) symptom onsets of case-patients detected in 3 areas; C) geographic distribution of cases detected in 3 areas. The periods covered by waves 2 and 3 are shown in Figure 1.
1These authors contributed equally to this article.
Page created: May 12, 2016
Page updated: May 12, 2016
Page reviewed: May 12, 2016
The conclusions, findings, and opinions expressed by authors contributing to this journal do not necessarily reflect the official position of the U.S. Department of Health and Human Services, the Public Health Service, the Centers for Disease Control and Prevention, or the authors' affiliated institutions. Use of trade names is for identification only and does not imply endorsement by any of the groups named above.