Volume 22, Number 7—July 2016
Research
Comparing Characteristics of Sporadic and Outbreak-Associated Foodborne Illnesses, United States, 2004–2011
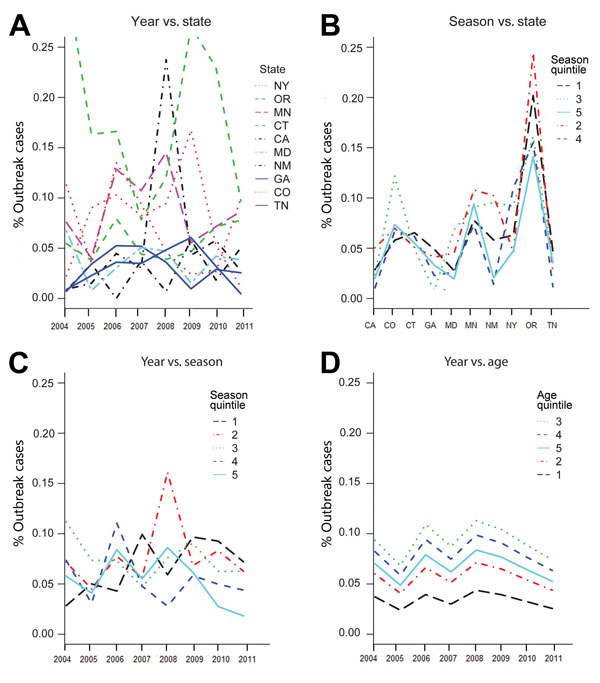
Figure 4

Figure 4. Interaction plots from the best-fitting Salmonella logistic regression model used in the analysis of Foodborne Diseases Active Surveillance Network (FoodNet) data, United States, 2004–2011. A) Year versus state; B) season versus state; C) year versus season; D) year versus age. The y-axis is the proportion of outbreak-associated cases. Crossing lines indicate interactions between 2 factors for the proportion of outbreak-associated case.
Page created: June 14, 2016
Page updated: June 14, 2016
Page reviewed: June 14, 2016
The conclusions, findings, and opinions expressed by authors contributing to this journal do not necessarily reflect the official position of the U.S. Department of Health and Human Services, the Public Health Service, the Centers for Disease Control and Prevention, or the authors' affiliated institutions. Use of trade names is for identification only and does not imply endorsement by any of the groups named above.