Volume 3, Number 3—September 1997
Perspective
Resistance, Remission, and Qualitative Differences in HIV Chemotherapy
Denise E. Kirschner* and G.F. Webb
and G.F. Webb
Figure 4
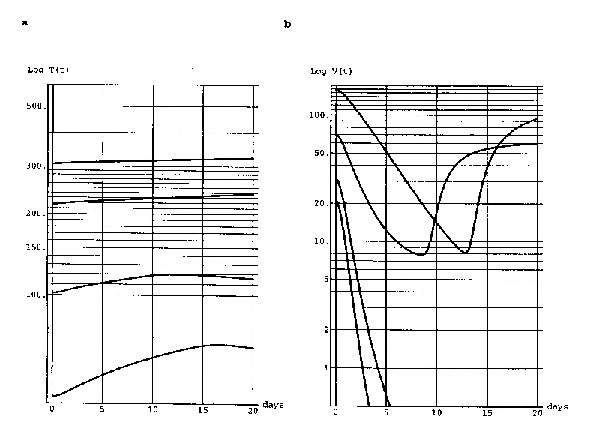
Figure 4. Four treatment simulations having a common viral set-point of disease progression. The treatment starting values are as in Figure 2. For all four simulations, the treatment parameters are c1=2.0, c2=2.0, c3=.05, the resistance mutation parameter is q=10 -8, and the threshold value is V0=2.0. Remission is achieved for the two lowest viral starting values, but the other two develop resistance. The viral exponential decay rates are -1.4, -.93, -.51, and -.26, which are inversely correlated to the viral starting values (an indication of rapid suppression of virus in the external lymphoid compartment).
Page created: December 21, 2010
Page updated: December 21, 2010
Page reviewed: December 21, 2010
The conclusions, findings, and opinions expressed by authors contributing to this journal do not necessarily reflect the official position of the U.S. Department of Health and Human Services, the Public Health Service, the Centers for Disease Control and Prevention, or the authors' affiliated institutions. Use of trade names is for identification only and does not imply endorsement by any of the groups named above.