Volume 6, Number 3—June 2000
Research
Using Remotely Sensed Data To Identify Areas at Risk for Hantavirus Pulmonary Syndrome
Gregory E. Glass* , James E. Cheek†, Jonathan A. Patz*, Timothy M. Shields*, Timothy J. Doyle‡, Douglas A. Thoroughman†, Darcy K. Hunt†, Russell E. Enscore§, Kenneth L. Gage§, Charles Irland†, C. J. Peters¶, and Ralph Bryan§
Figure 3
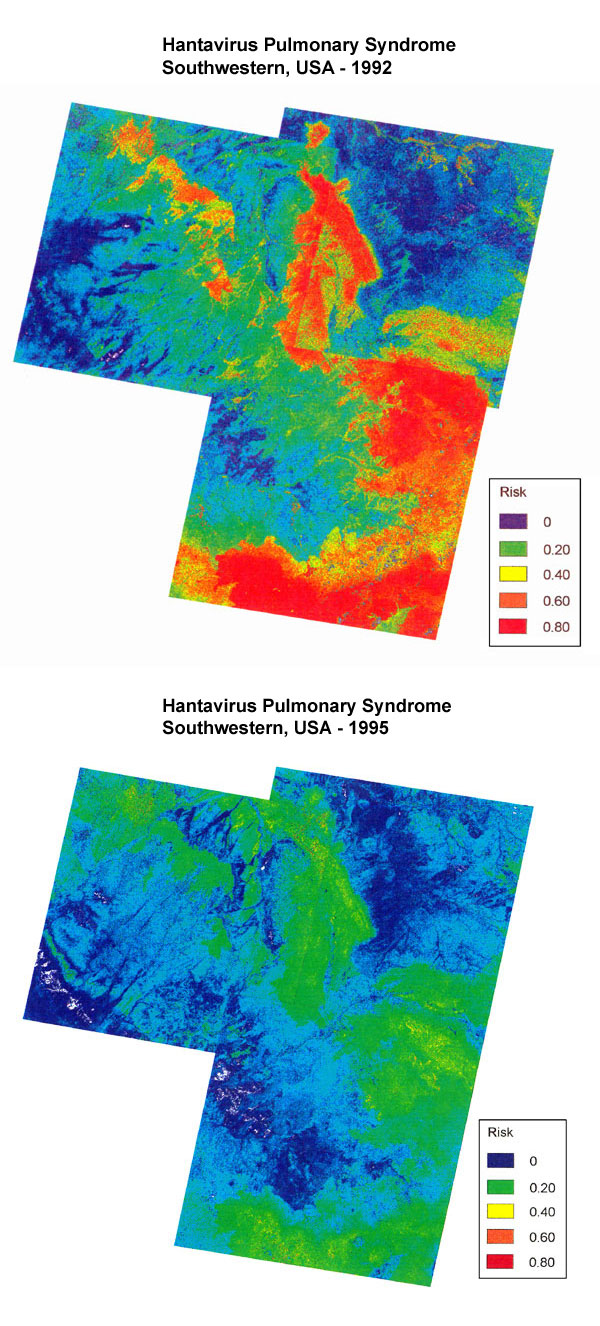
Figure 3. Comparison of predicted HPS risk for 1993 (top) and 1996 (bottom) by satellite imagery taken in 1992 and 1995, respectively, in the study area. Low-risk areas are in dark blue and high-risk areas are in red and yellow. There was a significant reduction in predicted high-risk areas in 1996 compared with 1993.
Page created: December 16, 2010
Page updated: December 16, 2010
Page reviewed: December 16, 2010
The conclusions, findings, and opinions expressed by authors contributing to this journal do not necessarily reflect the official position of the U.S. Department of Health and Human Services, the Public Health Service, the Centers for Disease Control and Prevention, or the authors' affiliated institutions. Use of trade names is for identification only and does not imply endorsement by any of the groups named above.