Skip directly to site content Skip directly to page options Skip directly to A-Z link Skip directly to A-Z link Skip directly to A-Z link
Volume 13, Number 3—March 2007
Research

Matrix Protein 2 Vaccination and Protection against Influenza Viruses, Including Subtype H5N1

Stephen Mark Tompkins*1Comments to Author , Zi-Shan Zhao*, Chia-Yun Lo*, Julia A. Misplon*, Teresa Liu*, Zhiping Ye*, Robert J. Hogan†, Zhengqi Wu*, Kimberly A. Benton*, Terrence M. Tumpey‡, and Suzanne L. Epstein*
Author affiliations: *Food and Drug Administration, Bethesda, Maryland, USA; †University of Georgia, Athens, Georgia, USA; ‡Centers for Disease Control and Prevention, Atlanta, Georgia, USA;

Main Article

Figure 7

Results of vaccination with matrix protein 2 (M2)–DNA plus M2-adenovirus (Ad) and challenge with heterologous H5N1 subtype. Mice (10 per group) were vaccinated with A/NP-DNA, M2-DNA, or B/NP-DNA and boosted with matched Ad, as described in the Methods. Seventeen days after Ad boost, mice were challenged with 10× 50% lethal dose (LD50) of SP-83 (H5N1). A random subset pf mice (4/group) were humanely killed on day 5, and their lungs were assayed for virus titer, as described in the Methods. A). Re

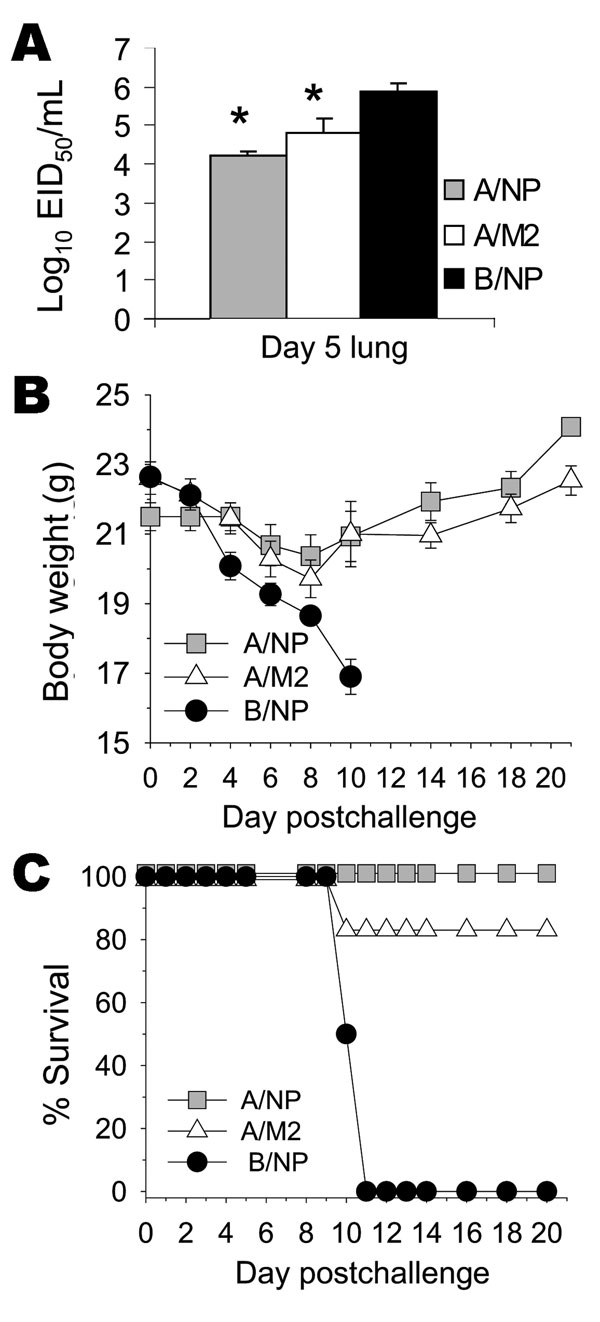
Figure 7. Results of vaccination with matrix protein 2 (M2)–DNA plus M2-adenovirus (Ad) and challenge with heterologous H5N1 subtype. Mice (10 per group) were vaccinated with A/NP-DNA, M2-DNA, or B/NP-DNA and boosted with matched Ad, as described in the Methods. Seventeen days after Ad boost, mice were challenged with 10× 50% lethal dose (LD50) of SP-83 (H5N1). A random subset pf mice (4/group) were humanely killed on day 5, and their lungs were assayed for virus titer, as described in the Methods. A). Remaining mice were monitored for weight loss (B) and survival (C). The cumulative survival rates for A/NP and M2 immune mice were significantly higher than those for B/NP-immune mice but did not differ from each other significantly (p<0.001, log-rank, Holm-Sidak pairwise comparison: p<0.05 comparing B/NP with A/NP or M2 groups, p≥0.05 comparing A/NP and M2 groups). *Lung virus titers in A/NP- and M2-immune mice were significantly lower than in B/NP-immune mice but did not differ from each other significantly (p = 0.004, analysis of variance. Holm-Sidak pairwise comparison: p<0.05 comparing B/NP with A/NP or M2 groups, p≥0.05 comparing A/NP and M2 groups). SARS, severe acute respiratory syndrome; IFN-γ, interferon-γ.

Main Article

1Current affiliation: University of Georgia, Athens, Georgia, USA

Page created: June 29, 2010
Page updated: June 29, 2010
Page reviewed: June 29, 2010
The conclusions, findings, and opinions expressed by authors contributing to this journal do not necessarily reflect the official position of the U.S. Department of Health and Human Services, the Public Health Service, the Centers for Disease Control and Prevention, or the authors' affiliated institutions. Use of trade names is for identification only and does not imply endorsement by any of the groups named above.
file_external