Volume 14, Number 3—March 2008
Research
High Rate of Mobilization for blaCTX-Ms
Miriam Barlow* , Rebecca A. Reik†, Stephen D. Jacobs*, Mónica Medina*, Matthew P. Meyer*, John E. McGowan†, and Fred C. Tenover‡
Figure 2
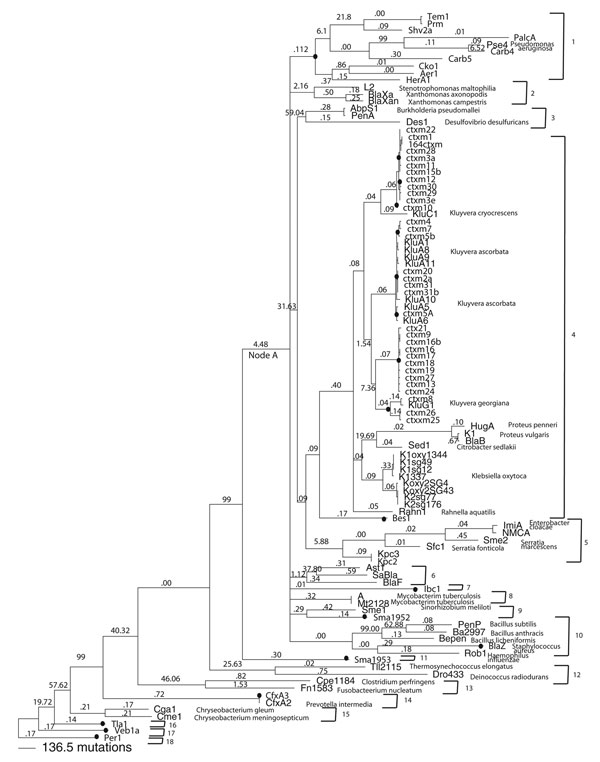
Figure 2. Phylogenetic analysis of class A β-lactamases calculated by Bayesian inference. Number of mutations occurring along each branch are represented visually by the lengths of the branches. dN /dS ratios for all branches except the tips are given along the lengths of the branches. Boldface indicates plasmidic genes. Black dots indicate mobilizations to plasmids. Numbered brackets indicate monophyletic divisions within the tree. *dN, nonsynonymous substitution rate; dS, synonoymous substitution rate.
Page created: July 07, 2010
Page updated: February 26, 2015
Page reviewed: February 26, 2015
The conclusions, findings, and opinions expressed by authors contributing to this journal do not necessarily reflect the official position of the U.S. Department of Health and Human Services, the Public Health Service, the Centers for Disease Control and Prevention, or the authors' affiliated institutions. Use of trade names is for identification only and does not imply endorsement by any of the groups named above.