Skip directly to site content Skip directly to page options Skip directly to A-Z link Skip directly to A-Z link Skip directly to A-Z link
Volume 21, Number 3—March 2015
Research

Evaluation of the Benefits and Risks of Introducing Ebola Community Care Centers, Sierra Leone

Adam J. KucharskiComments to Author , Anton Camacho, Francesco Checchi, Ron Waldman, Rebecca F. Grais, Jean-Clement Cabrol, Sylvie Briand, Marc Baguelin, Stefan Flasche, Sebastian Funk, and W. John Edmunds
Author affiliations: London School of Hygiene and Tropical Medicine, London, UK (A.J. Kucharski, A. Camacho, M. Baguelin, S. Flasche, S. Funk, W.J. Edmunds); Save the Children, London (F. Checchi); Milken Institute School of Public Health, George Washington University, Washington, DC, USA (R. Waldman); Epicentre, Paris, France (R.F. Grais); Médecins sans Frontières, Geneva, Switzerland (J.-C. Cabrol); World Health Organization, Geneva (S. Briand)

Main Article

Figure 3

Factors influencing reduction or amplification of Ebola virus infection in the community if 500 CCC beds were introduced in Western Area, Sierra Leone, on December 15, 2014. A) Change in infection compared with baseline scenario (259 Ebola treatment center beds) between December 1, 2014, and February 1, 2015, for a range of values for reduction in transmission and probability of exposure to virus. Median parameter estimates for Western Area were used (Table). B) Change in infection over time. Bl

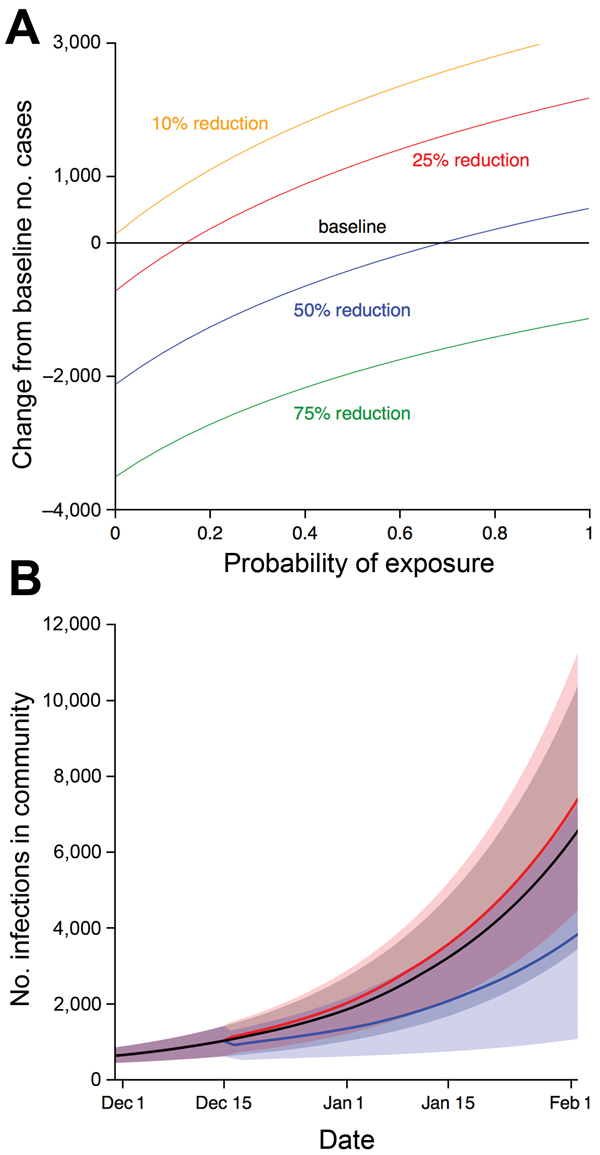
Figure 3. Factors influencing reduction or amplification of Ebola virus infection in the community if 500 CCC beds were introduced in Western Area, Sierra Leone, on December 15, 2014. A) Change in infection compared with baseline scenario (259 Ebola treatment center beds) between December 1, 2014, and February 1, 2015, for a range of values for reduction in transmission and probability of exposure to virus. Median parameter estimates for Western Area were used (Table). B) Change in infection over time. Black line, baseline scenario. Blue line, 500 CCC beds with transmission reduced by 75% (blue line in A), and Ebola virus–negative patients have 25% probability of exposure to virus. Red line, 500 CCC beds with transmission reduced by 25% (red line in A), and Ebola virus–negative patients have 50% probability of exposure to virus. Shaded areas show 95% bootstrapped credible intervals generated from 1,000 simulations with parameters sampled from posterior estimates. We assumed that time from symptom onset to CCC attendance was 3 days and that 50% of symptomatic patients were Ebola virus–positive. CCC, Ebola community care center.

Main Article

Page created: February 18, 2015
Page updated: February 18, 2015
Page reviewed: February 18, 2015
The conclusions, findings, and opinions expressed by authors contributing to this journal do not necessarily reflect the official position of the U.S. Department of Health and Human Services, the Public Health Service, the Centers for Disease Control and Prevention, or the authors' affiliated institutions. Use of trade names is for identification only and does not imply endorsement by any of the groups named above.
file_external