Skip directly to site content Skip directly to page options Skip directly to A-Z link Skip directly to A-Z link Skip directly to A-Z link
Volume 21, Number 8—August 2015
Research

Response Strategies against Meningitis Epidemics after Elimination of Serogroup A Meningococci, Niger

Halima Boubacar MaïnassaraComments to Author , Juliette Paireau, Issa Idi, Jean-Paul Moulia Pelat, Odile Ouwe Missi Oukem-Boyer, Arnaud Fontanet, and Judith E. Mueller
Author affiliations: Université Pierre et Marie Curie, Paris (H.B. Maïnassara, J. Paireau); Institut Pasteur, Paris, France (H.B. Maïnassara, J. Paireau, A. Fontanet, J.E. Mueller); Centre de Recherche Médicale et Sanitaire, Niamey, Niger (H.B. Maïnassara, I. Idi, J.-P.M. Pelat, O.O.M. Oukem-Boyer); Chaire Santé et Développement, Paris (A. Fontanet); Ecole des Hautes Études en Santé Publique, Rennes, France (J.E. Mueller)

Main Article

Figure 3

Comparison of preventable meningitis cases per 100,000 vaccine doses, given different surveillance and meningococcal vaccine response strategies, in a situation simulating elimination of Neisseria meningitides serogroup A, Tahoua, Tillabery, and Dosso regions, Niger, 2002–2012. Three, 4, 5, and 6 weeks delay were considered between epidemic detection and effective vaccine protection. The strategies were surveillance and vaccination at health area level (health area–health area, top 3 lines), sur

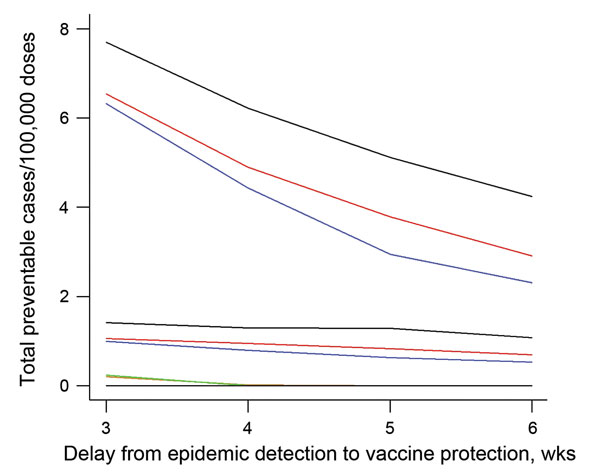
Figure 3. Comparison of preventable meningitis cases per 100,000 vaccine doses, given different surveillance and meningococcal vaccine response strategies, in a situation simulating elimination of Neisseria meningitides serogroup A, Tahoua, Tillabery, and Dosso regions, Niger, 2002–2012. Three, 4, 5, and 6 weeks delay were considered between epidemic detection and effective vaccine protection. The strategies were surveillance and vaccination at health area level (health area–health area, top 3 lines), surveillance at health area level combined with vaccination of the district (health area–district, middle 3 lines), and surveillance and vaccination at district level (district–district, bottom 3 lines). For the health area–health area and health area–district strategies, the black line indicates preventable cases/100,000 vaccine doses at an incidence threshold of 7 cases/100,000 inhabitants; red line, threshold of 10 cases/100,000 inhabitants; and blue line, threshold of 15 cases/100,000 inhabitants. For the district–district strategy, the green line indicates preventable cases/100,000 vaccine doses at an incidence threshold of 4 cases/100,000 inhabitants; orange line, threshold of 2 cases/100,000 inhabitants; and black line, threshold of 7 cases/100,000 inhabitants.

Main Article

Page created: July 14, 2015
Page updated: July 14, 2015
Page reviewed: July 14, 2015
The conclusions, findings, and opinions expressed by authors contributing to this journal do not necessarily reflect the official position of the U.S. Department of Health and Human Services, the Public Health Service, the Centers for Disease Control and Prevention, or the authors' affiliated institutions. Use of trade names is for identification only and does not imply endorsement by any of the groups named above.
file_external