Volume 22, Number 3—March 2016
Research
Faster Detection of Poliomyelitis Outbreaks to Support Polio Eradication
Figure 3
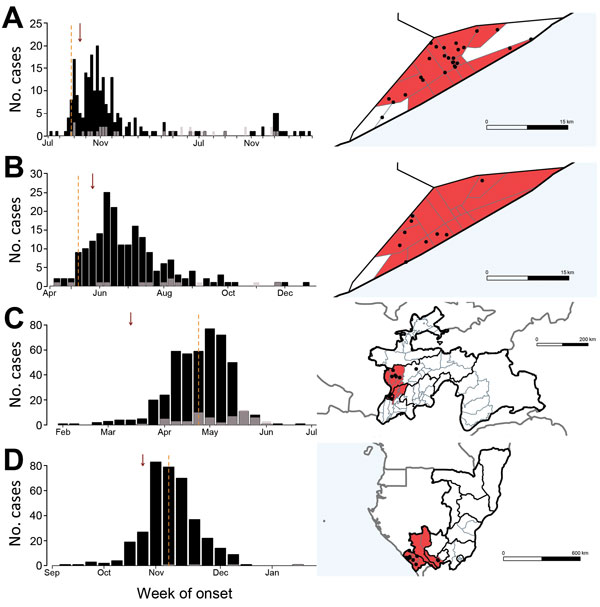
Figure 3. Incidence of serotype 1 poliomyelitis cases and time and location of 4 large outbreaks in Somalia, Tajikistan, and Congo: A) Somalia, 2005–2007; B) Somalia, 2013; C) Tajikistan, 2010; D) Congo, 2010. The charts on the left indicate weekly incidence of confirmed polio (black) and polio-compatible (gray) cases (by onset date of acute flaccid paralysis, AFP); vertical dashed lines indicate the date the outbreak was officially confirmed and arrows the date that an alarm would have been raised for detection of AFP clustering. Maps on the right show the second administrative divisions (districts) containing the significant cluster of acute flaccid paralysis cases; divisions are colored red if the alarm cylinder included its centroid. Each dot corresponds to a confirmed poliomyelitis case, plotted randomly within the corresponding district of occurrence. Maps in panels A and B show the administrative divisions of Banadir in Somalia. Gray lines in maps in panels C and D indicate neighboring countries. Blue shading indicates the sea. The publication of these maps does not imply the expression of any opinion whatsoever on the part of World Health Organization (WHO) concerning the legal status of any territory, city, or area or of its authorities or concerning the delimitation of its frontiers or boundaries. WHO does not endorse or approve the use of subnational boundaries in this map.