Volume 21, Number 8—August 2015
Dispatch
Transmission Models of Historical Ebola Outbreaks
Cite This Article
Citation for Media
Abstract
To guide the collection of data under emergent epidemic conditions, we reviewed compartmental models of historical Ebola outbreaks to determine their implications and limitations. We identified future modeling directions and propose that the minimal epidemiologic dataset for Ebola model construction comprises duration of incubation period and symptomatic period, distribution of secondary cases by infection setting, and compliance with intervention recommendations.
Mathematical models are used to generate epidemic projections under different scenarios, provide indicators of epidemic potential, and highlight essential needs for data. To aid the interventions in the 2014 Ebola epidemic in West Africa, in September 2014 we reviewed models of historical Ebola virus (EBOV) outbreaks (Table 1) and their estimated parameters (Table 2; Technical Appendix).
Figure
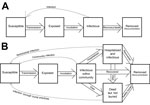
Figure. Conceptual diagrams illustrating Ebola SEIR and SEIHFR models of historical Ebola virus outbreaks. SEIR, susceptible-exposed-infectious-removed; SEIHFR, susceptible-exposed-infectious-hospitalized-funeral-removed.
Chowell et al. (1) developed a deterministic SEIR (susceptible-exposed-infectious-recovered) compartmental model and a stochastic continuous-time Markov chain version (Figure). A transmission coefficient, β0, was assumed to be constant before interventions and reduced transmission after intervention at a constant rate, β1. The model was fit to cases from the 1995 Democratic Republic of Congo (DRC) outbreak and the 2000 Uganda outbreak by using least squares. The final size was sensitive to the timing of control measures. The authors concluded that a 2-week delay in the timing of interventions would have increased the final size of the outbreak by a factor of 2.
Lekone and Finkenstädt (4) modified the model of Chowell et al. for discrete-time, stochastic progression. They fit their model to daily incidence and mortality time series from the 1995 DRC outbreak using Markov chain Monte Carlo. R0 was estimated by using vague and informative prior distributions. This exercise concluded that interventions shortened the epidemic from 950 days to 200 days and reduced total number of cases from 3.5 million to just over 300. Effective reproduction number (RE) was estimated to decrease to <1 five days after intervention onset.
Legrand et al. (5) accounted for transmission in different contexts through a stochastic model with 6 compartments: susceptible, exposed, infectious, hospitalized, dead-but-not-yet-buried, removed (Figure). Three transmission coefficients corresponded to community transmission, nosocomial transmission, and transmission at funerals. Interventions were assumed to be completely efficient from their onset: no transmission occurred at burials and hospitals, and community transmission was reduced by a multiplier estimated by model fitting. Parameters were estimated by fitting the model to incidence data (DRC, 1995; Uganda, 2000), by using approximate maximum likelihood, and an expression for R0 was derived. After interventions, community transmission was estimated to have been reduced to 88% and 12% of its initial value in the DRC and Uganda outbreaks, respectively, with respective RE of 0.4 (95% CI 0.3–0.6) and 0.3 (95% CI 0.2–0.4). The authors acknowledged that the 95% CIs around transmission and efficacy estimates were wide and conducted a sensitivity analysis of intervention parameters. This analysis indicated that community transmission was key to epidemic dynamics in Uganda, whereas funerals contributed more to transmission in the DRC. Rapid hospitalization significantly reduced community transmission and barrier nursing practices along with effective isolation of Ebola patients controlled the epidemics (5).
These models (1,4,5) shared certain features. They assumed homogeneous mixing of the population, exponentially or geometrically distributed incubation and infectious periods, and a sudden decay in transmission after intervention. None accounted for underreporting. Future exercises should explore the consequences of these assumptions. With ideal data, fitted models would be stress-tested to assess their validity, for instance challenging models to predict out-of-fit data.
Three additional studies estimated incubation period or R0 by using statistical models. Eichner et al. (10) assumed a log–normally distributed incubation period. Ferrari et al. (11) used maximum likelihood with a chain binomial distribution and regression to estimate R0. White and Pagano (12) assumed that the number of secondary cases produced by a patient followed a Poisson distribution, with expected value R0.
Collectively, these studies underscore that practical decisions in modeling dictate trade-offs between fitting to limited data and explicit representation of reality, including interventions. A model with a single transmission rate might fit well to data but might not be useful for decision making that evaluates intervention effects in different transmission contexts. A model with 3 transmission rates might represent transmission in community, nosocomial, and funeral contexts (e.g., [5]), but the 3 parameters are unlikely to be uniquely identifiable. Because EBOV typically amplifies during nosocomial transmission, a model with 2 transmission parameters (community transmission, comprising funeral and household transmission in 1 parameter, and nosocomial transmission) might represent the best compromise. Such a model would enable interventions, such as personal protective equipment and efficient hospitalization of persons with community-acquired EBOV infection, to be considered.
Other features are important for understanding the probable paths of small outbreaks. These include nonexponential incubation and infectious periods (13) and individual heterogeneity in the generation of secondary infections, including “super-spreaders” (14). The models reviewed are approximations to these processes. The extent to which these approximations introduce bias could be understood by developing a range of models, perhaps using versions of the chain binomial model or other generalized contagion processes.
Another issue that has not been studied is the role of spatial scale. All extensive EBOV outbreaks involved multiple scales of transmission. At the smallest scale, persons most at risk for infection are those caring for an Ebola patient. Understanding these household contacts helps estimate outbreak size. Human settlements constitute a “household of households.” Transmission occurs among households in communities, at hospitals, or at funerals. Understanding these between-household contacts is needed to determine the outbreak’s extent. Finally, understanding connections between settlements by human movements is needed to determine the paths and speed of large-scale spatial spread and therefore the total infected area and domain for surveillance and monitoring. Although the assumption of population homogeneity can be justified for models of historical EBOV outbreaks, given the limited geographic extent of those outbreaks, models for the 2014 outbreak might need to address heterogeneity in population density and human movements because of the extensive geography involved.
Two issues new to the 2014 EBOV epidemic are underreporting and compliance. To assess underreporting, perhaps comprehensive contact tracing can be performed in a small number of locales and extrapolated. If cases can be identified through 2 independent routes, then case matching can be used to identify the total number of cases (15). Concerning compliance, the fraction of patients admitted to hospitals and, of those remaining in the community, the fraction of decedents with safe burials should be identified. Compliance of personal protective equipment among health care workers is central to understanding the role of nosocomial transmission.
Model fitting is craft as well as science. Modeling demands decisions, including what mathematical representations to use, the type and magnitude of variation to be considered, and the values that can be taken as given versus the values still to be estimated. In the face of data scarcity, we suggest that construction of models of the 2014 outbreak would have benefited from a minimal dataset that included 1) the mean and variance of the incubation period and symptomatic period, respectively; 2) the probability distribution of secondary cases by infection setting; and 3) compliance with recommendations. For secondary cases, in addition to the average, the commonness of outliers (super-spreaders), the frequency of zeros, and the variance in the distribution need to be known.
Dr. Drake is an associate professor in the Odum School of Ecology, University of Georgia, Athens, Georgia, USA. His research focuses on the theory and modeling of epidemic dynamics.
Acknowledgments
We thank Matthew Ferrari, Martin I. Meltzer, Pej Rohani, and Zhisheng Shuai for helpful discussion and critical comments on previous versions of this manuscript.
J.M.D. is supported by the National Institute of General Medical Sciences of the National Institutes of Health under award no. U01GM110744. M.G. is supported by the National Health and Medical Research Council of Australia.
References
- Chowell G, Hengartner NW, Castillo-Chavez C, Fenimore PW, Hyman JM. The basic reproductive number of Ebola and the effects of public health measures: the cases of Congo and Uganda. J Theor Biol. 2004;229:119–26. DOIPubMedGoogle Scholar
- Khan AS, Tshioko FK, Heymann DL, Le Guenno B, Nabeth P, Kerstiens B, The reemergence of Ebola hemorrhagic fever, Democratic Republic of the Congo, 1995. Commission de Lutte contre les Epidemies a Kikwit. J Infect Dis. 1999;179(Suppl 1):S76–86. DOIPubMedGoogle Scholar
- World Health Organization. Outbreak of Ebola haemorrhagic fever, Uganda, August 2000–January 2001. Wkly Epidemiol Rec. 2001;76:41–6 .PubMedGoogle Scholar
- Lekone PE, Finkenstadt BF. Statistical inference in a stochastic epidemic SEIR model with control intervention: Ebola as a case study. Biometrics. 2006;62:1170–7. DOIPubMedGoogle Scholar
- Legrand J, Grais RF, Boelle PY, Valleron AJ, Flahault A. Understanding the dynamics of Ebola epidemics. Epidemiol Infect. 2007;135:610–21. DOIPubMedGoogle Scholar
- Muyembe-Tamfum JJ, Kipasa M, Kiyungu C, Colebunders R. Ebola outbreak in Kikwit, Democratic Republic of the Congo: discovery and control measures. J Infect Dis. 1999;179(Suppl 1):S259–62. DOIPubMedGoogle Scholar
- Guimard Y, Bwaka MA, Colebunders R, Calain P, Massamba M, De Roo A, Organization of patient care during the Ebola hemorrhagic fever epidemic in Kikwit, Democratic Republic of the Congo, 1995. J Infect Dis. 1999;179(Suppl 1):S268–73. DOIPubMedGoogle Scholar
- Kerstiëns B, Matthys F. Interventions to control virus transmission during an outbreak of Ebola hemorrhagic fever: experience from Kikwit, Democratic Republic of the Congo, 1995. J Infect Dis. 1999;179(Suppl 1):S263–7. DOIPubMedGoogle Scholar
- Centers for Disease Control and Prevention. Outbreak of Ebola hemorrhagic fever Uganda, August 2000–January 2001. MMWR Morb Mortal Wkly Rep. 2001;50:73–7 .PubMedGoogle Scholar
- Eichner M, Dowell SF, Firese N. Incubation period of Ebola hemorrhagic virus subtype Zaire. Osong Public Health Res Perspect. 2011;2:3–7.
- Ferrari MJ, Bjornstad ON, Dobson AP. Estimation and inference of R0 of an infectious pathogen by a removal method. Math Biosci. 2005;198:14–26. DOIPubMedGoogle Scholar
- White LF, Pagano M. A likelihood-based method for real-time estimation of the serial interval and reproductive number of an epidemic. Stat Med. 2008;27:2999–3016. DOIPubMedGoogle Scholar
- Wearing HJ, Rohani P, Keeling MJ. Appropriate models for the management of infectious diseases. PLoS Med. 2005;2:e174. DOIPubMedGoogle Scholar
- Lloyd-Smith JO, Schreiber SJ, Kopp PE, Getz WM. Superspreading and the effect of individual variation on disease emergence. Nature. 2005;438:355–9. DOIPubMedGoogle Scholar
- Chao A, Tsay PK, Lin SH, Shau WY, Chao DY. The applications of capture–recapture models to epidemiological data. Stat Med. 2001;20:3123–57. DOIPubMedGoogle Scholar
Figure
Tables
Cite This Article1These authors contributed equally to this article.
Table of Contents – Volume 21, Number 8—August 2015
| EID Search Options |
|---|
|
|
|
|
|
|
Please use the form below to submit correspondence to the authors or contact them at the following address:
Isaac Chun-Hai Fung, Jiann-Ping Hsu College of Public Health, Georgia Southern University, Statesboro, GA 30460-8015, USA
Top