Volume 18, Number 3—March 2012
Research
Pathogenic Potential to Humans of Bovine Escherichia coli O26, Scotland
Cite This Article
Citation for Media
Abstract
Escherichia coli O26 and O157 have similar overall prevalences in cattle in Scotland, but in humans, Shiga toxin–producing E. coli O26 infections are fewer and clinically less severe than E. coli O157 infections. To investigate this discrepancy, we genotyped E. coli O26 isolates from cattle and humans in Scotland and continental Europe. The genetic background of some strains from Scotland was closely related to that of strains causing severe infections in Europe. Nonmetric multidimensional scaling found an association between hemolytic uremic syndrome (HUS) and multilocus sequence type 21 strains and confirmed the role of stx2 in severe human disease. Although the prevalences of E. coli O26 and O157 on cattle farms in Scotland are equivalent, prevalence of more virulent strains is low, reducing human infection risk. However, new data on E. coli O26–associated HUS in humans highlight the need for surveillance of non-O157 enterohemorrhagic E. coli and for understanding stx2 phage acquisition.
Enteropathogenic Escherichia coli (EPEC) and enterohemorrhagic E. coli (EHEC) are gastrointestinal pathogens associated with asymptomatic carriage and human diseases ranging from mild diarrhea to hemorrhagic colitis and hemolytic uremic syndrome (HUS) (1). Worldwide, EHEC serogroup O157 strains are responsible for most human Shiga toxin–producing E. coli (STEC) infections (2). However, recent outbreaks in Germany (3) and the United States (4) have highlighted the increasing role of other Shiga toxin–producing serogroups (termed non-O157 strains) in causing human disease.
The pathogenesis of EHEC strains is associated with production of Shiga toxins expressed from lysogenic bacteriophages in the EHEC genome. There are 2 predominant classes of Shiga toxins (1 and 2), each encoded from 2 genes, stxAB, with the genotypes simplified to stx1 or stx2 in this study. Whereas EHEC is regarded as an emerging zoonotic pathogen, the related EPEC strains cause diarrhea, especially in infants in developing countries (1).
EPEC and EHEC express a type III secretion (T3S) system that translocates multiple effector proteins into host cells and manipulate host innate responses, which are needed for colonization (5–7). The T3S system is central to the formation of attaching and effacing lesions on the intestinal epithelium that requires the bacterial outer membrane protein intimin (encoded by eae) and the secreted bacterial protein—the translocated intimin receptor (Tir)—that is injected into the host cell. Studies of EPEC and EHEC O157 show that these pathogens trigger different actin polymerization pathways respectively involving Tir cytoskeleton coupling proteins (tccP or tccP2) (5). The formation of attaching and effacing lesions is needed for bacterial colonization by EHEC O157 and EHEC O26 in cattle. However, Shiga toxin (Stx) is the principal factor responsible for severe human illness, including HUS (8). Strains with stx2 alone appear more strongly associated with HUS than do strains with only stx1 (8–10). These observations have been supported by mouse (11) and primate models (12).
Among non-O157 EHEC, Stx-producing E. coli O26 also causes human disease (13–15) and has been isolated from livestock (16). However, unlike EHEC serogroup O157, it may be pathogenic for both cattle and humans (17). Although the origin of human E. coli O26 infections is rarely identified (18), evidence exists of person-to-person spread (19) and foodborne transmission (20). Furthermore, because EHEC O26 has been isolated from the feces of cattle and other animals (16,21,22), potential exists for direct and indirect zoonotic transmission to humans (20).
In the United Kingdom, Stx-producing human E. coli O26 infections are usually uncommon and not clinically severe. Most identified EHEC infections are associated with serogroup O157, and incidence rates in Scotland are among the highest, compared with rates in countries with comparable surveillance (23). In contrast with human infection rates, farm and animal prevalence of E. coli serogroups O26 and O157 are similar in Scotland (21).
Our first objective was to identify the cause of the disparity between the incidence of E. coli O157 and O26 infections among humans in Scotland by examining the natural heterogeneity among serogroup O26 strains and reexamining their prevalence in cattle. As a second objective, we used different molecular techniques to compare the relationships between E. coli O26 isolates recovered from humans and cattle.
Bacterial Isolates
All bacterial isolates used in this research are shown in Table 1. All isolates from cattle were collected in parallel with a prevalence study of E. coli O157 in cattle in Scotland, conducted during 2002–2004 (21). Fecal samples were obtained from cattle on 338 farms to test for non-O157 E. coli strains, including serogroup O26, as described by Pearce et al. (21). Human E. coli O26 isolates came from collections within the United Kingdom, Ireland, and continental Europe.
PCR for Virulence Genes
Genes encoding stx1, stx2, eae, and hlyA were detected by using multiplex PCR (24). Possession of the locus of enterocyte effacement (LEE) pathogenicity island was confirmed by PCR screening for sepL. Genes encoding tccP and tccP2 were detected with PCR by using universal primer pair univtccP/tccP2-F and tccP-R (25). Primers and PCR conditions used in this study are listed in Table 2.
Pulsed-field Gel Electrophoresis
We performed pulsed-field gel electrophoresis (PFGE) on 187 isolates (33 from humans and 154 from cattle) (Table 1) by using the method of Willshaw et al. (26), standardized by the Scottish E. coli O157/VTEC Reference Laboratory (SERL; Edinburgh, UK) and the Laboratory of Gastrointestinal Pathogens (Colindale, UK). A phage λ ladder (48.5 kb) was used as a DNA size standard, and gels were run with a linearly ramped switch time of 5–50 s applied for 38 h at a voltage of 5.4 V/cm and an included angle of 120°. PFGE profiles were analyzed by using BioNumerics (version 3.0) software (Applied Maths, Kortrijk, Belgium). The degree of similarity between profiles was determined by the Jaccard coefficient, and dendrograms were generated by using the unweighted pair group method with arithmetic mean with 1.3% tolerance and 1% optimization settings.
Multilocus Sequence Typing
We performed multilocus sequence typing (MLST) on 63 isolates (30 from humans and 33 from cattle) (Table 1) by using a method similar to that of Wirth et al. (27). Internal fragments of 7 housekeeping genes (adk, fumC, gyrB, icd, mdh, purA, and recA) were sequenced, and the allele numbers and sequence types (STs) were assigned in accordance with the E. coli MLST database (http://mlst.ucc.ie/mlst/dbs/Ecoli). The T3S system of E. coli O26 is encoded on the LEE, and this region was originally sequenced from E. coli O26 isolate 413/89–1 (GenBank accession no. AJ277443). From this sequence, primers were designed to amplify espA encoding the main translocation filament protein of the T3S system and a 644-bp region (5082–5726) including the promoter controlling expression of the first LEE operon (LEE1) (Table 2). Sequence data for espA and the LEE1 promoter region were compared by using ClustalX (www.clustal.org). Each unique sequence was given a different allele number assigned in the order in which they were discovered.
Data Management and Statistical Analyses
Prevalence of E. coli O26
Figure 1
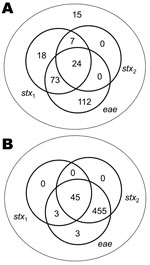
Figure 1. Isolates of Escherichia coli O26 (A; n = 249) and O157 (B; n = 507), collected from a 2002–2004 field survey, that illustrate the differences between the 2 serogroups from Scotland...
E. coli O26 isolated from cattle are more heterogeneous than E. coli O157 with respect to the presence of stx and eae (Figure 1). Therefore, we determined the prevalence of E. coli O26 for 4 different groups with potential differences in virulence: 1) all E. coli O26, similar to Pearce et al. (21); 2) stx1+; 3) stx1+stx2+; and 4) stx2+eae+. Farm-level and fecal pat–level prevalences were calculated by using the method of Pearce et al. (28). SAS version 9.1.3 (SAS Institute, Cary, NC, USA) was used to fit generalized linear mixed models and to generate bootstrap-based estimates of key parameters. Excel 2000 (Microsoft Corporation, Redmond, WA, USA) was used to implement a Latin hypercube sampling to convert results from generalized linear mixed models into prevalence taking into account random effects (29).
PFGE Analysis
Differences between isolates from humans and cattle were evaluated by assigning isolates to statistically distinct groups. The methods used are described in (30). Group membership was determined by estimating an optimum cutoff value using dendrogram-based distances. Statistical support for each group was evaluated by using the cophenetic correlation. The statistical significance of the cophenetic correlation was evaluated by using a Mantel test. Program zt (31) was used with 1,000 simulations, and the probability of the observed cophenetic correlation occurring by chance was <5% for groups of isolates regarded as statistically distinct.
A subset of 41 isolates from Scotland (8 from humans and 33 from cattle) were included in the MLST and PFGE analyses. The PFGE data for 3 isolates from humans were missing and therefore could not be included in the comparison. Agreement between these 2 techniques was examined.
Nonmetric Multidimensional Scaling
To identify patterns in data associated with the clinical severity of infection in humans, we used nonmetric multidimensional scaling (NMS) to analyze all genotype characteristics measured. PC-ORD software version 6.03 (MjM Software Design, Gleneden Beach, OR, USA) was used. The main matrix was created from the following isolate data: MLST type (ST, ST complex), tccP and tccP2, Stx status, hlyA, eae, LEE, and sequence upstream region of LEE1. A second matrix that used isolate data and an indicator of clinical severity was also created. Isolates were separated into 2 groups: 1) HUS and those associated with HUS and 2) non-HUS, including those from diarrhea, bloody diarrhea, and hemorrhagic colitis. The grouping was chosen because HUS has clearly identifiable clinical characteristics and is a reliable indicator of severe illness.
We used NMS with a Euclidian distance measure after standardizing each variable by division by its standard deviation. The dimensionality of the dataset was determined by plotting an inverse measure of fit (“stress”) to the number of dimensions. Optimal dimensionality was based on the number of dimensions with the lowest stress. A 3- dimensional solution was shown to be optimal. We performed several NMS runs to ensure that the solution was stable and probably represented a configuration with the best possible fit. For each NMS run, we used 500 iterations with random starting coordinates. The overall significance of the difference between HUS and non-HUS groups was assessed by using multiresponse permutation procedures (32).
Prevalence in Cattle
Figure 2
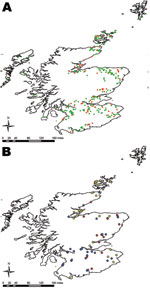
Figure 2. Location of farms sampled in 2002–2004 field survey for Escherichia coli O26, Scotland. A) Farms that were positive for E. coli O26 are shown in red; farms negative for E. coli...
Of the 338 farms visited, 68 were positive for E. coli O26 (mean prevalence 20.1%, exact binomial 95% CI 16.0–24.8); these 68 farms were evenly distributed across Scotland (Figure 2, panel A). Farms were classified by their isolates’ virulence groups: stx–, stx1+, and stx1+stx2+. No farm had stx2+ only strains. Farms with stx– isolates clustered in southern Scotland. Farms that were stx1+ were fairly evenly distributed, but those with stx1+stx2+ isolates were found mainly in the northeast (Figure 2, panel B). Analysis of the farms grouped according to their Scottish animal health district (21) significantly supported this observation (p = 0.005). No seasonal differences were observed (p = 0.59).
The adjusted mean overall prevalence of E. coli O26 was 0.22 (95% CI 0.18–0.27) and 0.046 (95% CI 0.031–0.062), respectively (Table 3). However, the adjusted mean prevalences for farms and fecal pats of stx2+eae+ E. coli O26 were lower at 0.05 (0.03–0.09) and 0.004 (0.001–0.007), respectively.
PFGE Genotyping
PFGE profiles of the 187 E. coli O26 isolates from 154 cattle and 33 humans were compared (Technical Appendix Figure 1). This comparison identified 4 groups comprising 5, 19, 142, and 16 isolates, which all included E. coli O26 isolates from cattle and humans. The 4 groups are characterized by statistically significant cophenetic correlations ranging from 0.807 to 0.945. Isolates from groups 2 and 4 were mainly stx–, whereas groups 1 and 3 were mainly stx+. Five isolates were not assigned to a group. All of the stx+ isolates from outside Scotland were in group 2, along with the 5 stx+ isolates from Scotland. The remaining isolates from Scotland were in group 1 (2 isolates), 2 (3 isolates), and 4 (1 isolates).
We compared PFGE profiles of the 41 E. coli O26 isolates from 33 cattle and 8 humans. PFGE grouping correlated strongly with MLST ST (Technical Appendix Figure 2). PFGE was more discriminative than MLST because each ST was represented by >1 PFGE pattern.
MLST Analysis
Irrespective of source, most isolates had a close genetic background (Table 4). Ninety percent of all isolates were either ST21 or ST29, both belonging to ST complex 29 and differing by 1 nt in the adk locus. Most isolates from continental Europe were ST21 (74%) and stx2+ (53%). Considerably fewer isolates from humans in Scotland were ST21 (36%) and stx2+ (18%). Other differences between Scotland and continental Europe were related to the relative absence of tccP2 in isolates from Scotland and the presence of different alleles upstream of LEE (Table 4). Isolates from cattle were genotypically more similar to those from humans from Scotland than from continental Europe (Table 4), except for the proportion of isolates that were ST21 and stx2+. This similarity may be explained by the fact that the isolates analyzed from cattle (33 [13%] of 249) were not a random sample of all isolates from cattle but were selected on their virulence properties (i.e., stx+ and eae+) to assess their potential to cause human infection rather than to provide a direct comparison with isolates from humans in Scotland.
Disease Severity Association
Before NMS analysis, 3 isolates were excluded because of missing data. ST complex, LEE, tccP, and eae were removed because no variation existed in the data (Table 4). The final matrix comprised 5 variables and 27 isolates. The final NMS solution was 3-dimensional and explained 90.8% of the variation in clinical severity and explained more variation than expected by chance (Monte Carlo, p = 0.008). Final stress for the 3-dimensional solution was 8.53 with no real risk for drawing false associations (32), and the final instability was 0 with 53 iterations.
Figure 3
![Thumbnail of Patterns in data associated with the clinical severity of Escherichia coli O157 and E. coli O26 infection in humans, as identified by nonmetric multidimensional scaling, Scotland. A) Joint graph illustrating the association between the multilocus sequence typing and genotypic variables measured and the severity of the human infection (hemolytic uremic syndrome [HUS] in red and non-HUS [diarrhea, bloody diarrhea] in green). B) 3-dimensional scatterplot and 80% confidence ellipses (R](/eid/images/11-1236-F3-tn.jpg)
Figure 3. Patterns in data associated with the clinical severity of Escherichia coli O26 infection in humans, as identified by nonmetric multidimensional scaling, Scotland. A) Joint graph illustrating the association between the multilocus...
The results of the NMS models are shown in joint graphs (Figure 3, panel A) and 3-dimensional ordination graphs (Figure 3, panel B) of the distance between sample units, which approximates dissimilarity in clinical severity. Where appropriate, R package version 2.12.1 (33) was used to add 80% confidence ellipsoids to discriminate between groups of interest. Variables used in the NMS analysis are shown as vectors; the direction indicates positive and negative correlation (Figure 3, panel A). Although some overlap exists, the difference between HUS and non-HUS groups was statistically significant (multiresponse permutation procedures, p = 0.007) (Figure 3, panel B). HUS was associated with ST21 and stx2, whereas non-HUS cases were associated with ST29 and the absence of stx2. The hlyA gene was not associated with either condition because 69% of non-HUS isolates possess hlyA and 67% of HUS isolates possess hlyA (Figure 3, panel A).
Although Stx-producing E. coli O26 is a major cause of HUS in continental Europe, human infection with this pathogen is uncommon in Scotland and has resulted in less severe illness. In contrast, E. coli O157 is a major cause of human infections and HUS (1). Previous reports of a high prevalence of E. coli O26 in cattle (21) do not appear to be matched by a high level of infection in humans. Our first objective was to determine whether this discrepancy could be explained by the natural heterogeneity in strains by examining virulence determinants associated with serious human disease in strains recovered from cattle in Scotland.
Figure 4
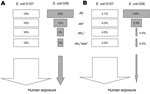
Figure 4. Schematic comparing farm-level (A) and animal-level (B) prevalences of Escherichia coli O157 and E. coli O26 in Scotland for different virulence levels. Analysis was done by using only the 338 farms...
The overall percentage of farms on which E. coli shedding was detected and the overall proportion of fecal pats positive were comparable for both organisms, but for E. coli O26, the farm and pat-level prevalence becomes smaller as the carriage of the virulence determinants eae and stx are taken into account (Figure 4). In contrast, the prevalence of virulent strains of E. coli O157 (stx+eae+) is not smaller. Thus, because there are fewer virulent strains at farm and animal levels, the risk for human illness is expected to be much lower for E. coli O26 than for E. coli O157 in Scotland.
Our second objective was to determine the genetic relationship of strains from different sources. PFGE characterization demonstrated that PFGE profiles of isolates from humans differed from those from cattle. This result was expected in the absence of a demonstrable epidemiologic link. However, human strains are widely distributed among groupings of isolates from cattle. Although an exact interpretation of relatedness of isolates from humans to animals is not possible, the isolates cannot be regarded as distinct populations. Further characterization by MLST confirmed that the genetic backbone of bovine and human E. coli O26 strains in Scotland match and that isolates from cattle in Scotland are closely related to highly pathogenic isolates from humans in Germany and Italy.
Characterization of human strains from Scotland and continental Europe and of bovine strains from Scotland showed that most E. coli O26 strains were ST29 and were likely to be capable of expressing a T3S system because they were eae and sepL positive. Although less virulent strains generally are present in cattle in Scotland, the unexpected finding of this study was that the genetic background of many of the strains shows a close relationship to strains causing severe human infections in continental Europe.
The use of NMS enables identification of an association between HUS and ST21 strains and confirms the role of stx2 alone in severe human disease. As previously suggested, the hlyA gene was not associated with HUS (8). Our results indicate that, in addition to stx2, tccP2 is linked to the severity of clinical disease. Therefore, the risk to humans in Scotland from isolates from cattle might be even lower for E. coli O26 if ST21 and the carriage of tccP2 are considered.
In the absence of stx genes, isolates from cattle feces are less of a threat to human health than E. coli O157 strains, but there are E. coli O26 in Scotland of ST21 that are LEE positive and carry tccP2. These need only to acquire the stx2-encoding bacteriophage and they could prove to be highly pathogenic because E. coli O26 is a highly dynamic group capable of acquiring stx-encoding phages (34,35). Zhang et al. (14) described a shift in stx genotype from stx1 to stx2: before 1994, only the stx1 gene was identified in their STEC O26 isolate collection, but after 1997, stx2 was the only genotype identified in 71% of the isolates. The trigger for this shift was not established.
At the time of our study, there was no correlation between farms in Scotland with E. coli O157 and E. coli O26 (p = 0.28) or those with E. coli O26 stx1+ stx2+ and E. coli O157 (p = 0.10). However, release of free stx-encoding bacteriophages into the intestinal environment (36,37) by STEC O157 or other EHEC may permit horizontal transfer of virulence genes to E. coli O26. Acquisition of stx2-encoding bacteriophages could confer E. coli O26 with greater pathogenic potential for humans, and possession of stx2 may alter the bovine immune response and lead to longer shedding and to larger quantities of the shed bacterium, resulting in greater exposure to humans. Changes in virulence characteristics of strains may also affect pathogen transmission in cattle (38) and thus pose a greater threat to humans from an increase in bacterial prevalence.
We suggest that limited human exposure in Scotland to E. coli O26 with virulence genes explains the recorded difference in the number of human infections attributed to E. coli O26 or E. coli O157. In addition, the more virulent forms of E. coli O26 (stx2+eae+) in cattle in Scotland were clustered in the sparsely populated northeast region. However, exposure routes and exposure doses for E. coli O26 and serogroup O157 may differ, although no evidence confirms this alternative explanation for the human infection rate differences. Although cattle are hypothesized as a potential reservoir of E. coli O26 (18), little is known about the transmission routes to humans and the only evidence linking human infection with cattle is 2 HUS cases in Austria indirectly linked to consumption of unpasteurized milk (20).
Figure 5
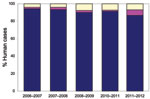
Figure 5. Escherichia coli O157 and Shiga toxin–producing non-O157 E. coli infection in humans in Scotland identified or confirmed by the Scottish E. coli O157/VTEC Reference Laboratory, Edinburgh, UK, by financial year (April–March)....
The approach to laboratory diagnosis of non-O157 E. coli gastrointestinal infection in humans has changed in recent years. At the time of this study, testing of samples from humans for non-O157 E. coli was conducted by a small number of clinical diagnostic laboratories by using polyvalent antiserum. E. coli O26 isolates were forwarded to the SERL for virulence typing by PCR. SERL identified additional E. coli O26 isolates by testing feces from patients with suspected STEC infection but who had negative routine culture results. However, since 2006–2007, non-O157 STEC detection in submitted fecal samples has been conducted solely by SERL by using PCR followed by culture and characterization of STEC. Since 2006–2007, the reported incidence of E. coli O26 in Scotland has increased from 1.6% of all STEC identified at SERL to 6% in 2010–2011 (Figure 5). The virulence patterns of E. coli O26 strains isolated from humans in Scotland also appear to have altered. The stx1+ E. coli O26 isolates previously predominated, but in 2010–2011, >50% of E. coli O26 isolates possessed both stx1 and stx2, and for the first time, 1 isolate from human feces was solely positive for stx2.
In 2010, three particularly severe sporadic cases of HUS associated with E. coli O26 in children were reported in Scotland (39). The characteristics of 2 of the E. coli O26 strains included stx1 and stx2 (39). To our knowledge, this was the first time >1 E. coli O26–attributed HUS case was reported in Scotland in a calendar year, reinforcing Bettelheim’s (40) warning that we ignore these strains at our peril. Worldwide, reports of human outbreaks of non-O157 EHEC, including E. coli O26, are common (2). In addition, the recent outbreak of E. coli O104:H4 in Germany highlights the potential for Shiga toxin prophage acquisition into different E. coli genetic backgrounds with serious consequences for human health (3).
Dr Chase-Topping is a postdoctoral research assistant in the Centre for Immunity, Infection and Evolution at the University of Edinburgh. Her research interests include statistical analysis of epidemiologic data.
Acknowledgments
We thank Geraldine Smith, Tom Cheasty, and the late Henry Smith and staff at the Scottish E. coli O157/VTEC Reference Laboratory for supplying clinical E. coli O26 isolates from their collection. In addition, we thank Simon Illingworth for technical advice. We also acknowledge the Scottish Executive Environment and Rural Affairs Department for providing data from the 2003 Scottish Agricultural and Horticultural Census. We are grateful to Sam Thumbi for mapping the data in Figure 1. We particularly acknowledge the work of clinical diagnostic laboratories and public and environmental health teams across Scotland with the challenging task of investigating infections in humans and providing invaluable data for enhanced surveillance.
This study was funded by Food Standards Agency, Scotland, and the International Partnership Research Award in Veterinary Epidemiology, Epidemiology and Evolution of Enterobacteriaceae Infections in Humans and Domestic Animals, funded by the Wellcome Trust. The Scottish Agricultural College acknowledges financial support from the Scottish Government; I.J.M. acknowledges financial support through project BSS/028/99. D.L.G acknowledges support from the Biotechnology and Biological Sciences Research Council UK at the Roslin Institute.
References
- Tarr PI, Gordon CA, Chandler WL. Shiga toxin-producing Escherichia coli and haemolytic uraemic syndrome. Lancet. 2005;365:1073–86.PubMedGoogle Scholar
- European Centre for Disease Prevention and Control. Annual epidemiological report on communicable diseases in Europe 2010 [cited 2010 Nov 2]. http://www.ecdc.europa.eu/en/publications/publications/1011
- Scheutz F, Møller Nielsen E, Frimodt-Møller J, Boisen N, Morabito S, Tozzoli R, Characteristics of the enteroaggregative Shiga toxin/verotoxin–producing Escherichia coli O104:H4 strain causing the outbreak of haemolytic uraemic syndrome in Germany, May to June 2011. Euro Surveill. 2011;16:pii:19889.PubMedGoogle Scholar
- Centers for Disease Control and Prevention. Foodnet—Foodborne Active Surveillance Network [cited 2010 Nov 2]. http://www.cdc.gov/foodnet
- Frankel G, Phillips AD. Attaching effacing Escherichia coli and paradigms of Tir-triggered actin polymerization: getting off the pedestal. Cell Microbiol. 2008;10:549–56. DOIPubMedGoogle Scholar
- Tree JJ, Wolfson EB, Wang D, Roe AJ, Gally DL. Controlling injection: regulation of type III secretion in enterohaemorrhagic Escherichia coli. Trends Microbiol. 2009;17:361–70. DOIPubMedGoogle Scholar
- Wong ARC, Pearson JS, Bright MD, Munera D, Robinson KS, Lee SF, Enteropathogenic and enterohaemorrhagic Escherichia coli: even more subversive elements. Mol Microbiol. 2011;80:1420–38. DOIPubMedGoogle Scholar
- Boerlin P, McEwen SA, Boerlin-Petzold F, Wilson JB, Johnson RP, Gyles CL. Association between virulence factors of Shiga toxin–producing Escherichia coli and disease in humans. J Clin Microbiol. 1999;37:497–503.PubMedGoogle Scholar
- Mellmann A, Bielaszewska M, Köck R, Friedrich AW, Fruth A, Middendorf B, Analysis of collection of hemolytic uremic syndrome-associated enterohemorrhagic Escherichia coli. Emerg Infect Dis. 2008;14:1287–90. DOIPubMedGoogle Scholar
- Käppeli U, Hächler H, Giezendanner N, Beutin L, Stephan R. Human infections with non-O157 Shiga toxin–producing Escherichia coli, Switzerland, 2000–2009. Emerg Infect Dis. 2011;17:180–5.PubMedGoogle Scholar
- Tesh VL, Burris JA, Owens JW, Gordon VM, Wadolkowski EA, Obrein AD, Comparison of the relative toxicities of Shiga-like toxins type-I and type-II for mice. Infect Immun. 1993;61:3392–402.PubMedGoogle Scholar
- Siegler RL, O’Brien TG, Pysher TJ, Tesh VL, Denkers ND, Taylor FB. Response to Shiga toxin 1 and 2 in a baboon model of hemolytic uremic syndrome. Pediatr Nephrol. 2003;18:92–6.PubMedGoogle Scholar
- Caprioli A, Tozzi AE, Rizzoni G, Karch H. Non-O157 Shiga toxin-producing Escherichia coli infections in Europe. Emerg Infect Dis. 1997;3:578–9. DOIPubMedGoogle Scholar
- Zhang WL, Bielaszewska M, Liesegang A, Tschäpe H, Schmidt H, Bitzan M, Molecular characteristics and epidemiological significance of Shiga toxin–producing Escherichia coli O26 strains. J Clin Microbiol. 2000;38:2134–40.PubMedGoogle Scholar
- Geue L, Klare S, Schnick C, Mintel B, Meyer K, Conraths FJ. Analysis of the clonal relationship of serotype O26:H11 enterohemorrhagic Escherichia coli isolates from cattle. Appl Environ Microbiol. 2009;75:6947–53. DOIPubMedGoogle Scholar
- Hutchinson JP, Cheney TEA, Smith RP, Lynch K, Pritchard GC. Verocytoxin-producing and attaching and effacing activity of Escherichia coli isolated from diseased farm livestock. Vet Rec. 2011;168:536. DOIPubMedGoogle Scholar
- Bettelheim KA. Non-O157 Verotoxin-producing Escherichia coli: a problem, paradox and paradigm. Exp Biol Med (Maywood). 2003;228:333–44.PubMedGoogle Scholar
- Jenkins C, Evans J, Chart H, Willshaw GA, Frankel G. Escherichia coli serogroup O26—a new look at an old adversary. J Appl Microbiol. 2008;104:14–25.PubMedGoogle Scholar
- McMaster C, Roch EA, Willshaw GA, Doherty A, Kinnear W, Cheasty T. Verocytotoxin-producing Escherichia coli serotype O26:H11 outbreak in an Irish creche. Eur J Clin Microbiol Infect Dis. 2001;20:430–2.PubMedGoogle Scholar
- Allerberger F, Freidrich AW, Grif K, Dierich MP, Dornbush HJ, Mache CJ, Hemolytic uremic syndrome associated with enterohemorrhagic Escherichia coli O26:H infection and consumption of unpasturized cow’s milk. Int J Infect Dis. 2003;7:42–5. DOIPubMedGoogle Scholar
- Pearce MC, Evans J, McKendrick IJ, Smith AW, Knight HI, Mellor DJ, Prevalence and virulence factors of Escherichia coli serogroups O26, O103, O111 and O145 shed by cattle in Scotland. Appl Environ Microbiol. 2006;72:653–9. DOIPubMedGoogle Scholar
- Evans J, Knight H, McKendrick IJ, Stevenson H, Varo Barbudo A, Gunn GJ, Prevalence of Escherichia coli O157:H7 and serogroups O26, O103, O111 and O145 in sheep presented for slaughter in Scotland. J Med Microbiol. 2011;60:653–60. DOIPubMedGoogle Scholar
- Chase-Topping M, Gally D, Low C, Matthews L, Woolhouse M. Super-shedding and the link between human infection and livestock carriage of Escherichia coli O157. Nat Rev Microbiol. 2008;6:904–12. DOIPubMedGoogle Scholar
- Paton AW, Paton JC. Detection and characterization of Shiga toxigenic Escherichia coli by using multiplex PCR assays for stx1, stx2, eaeA, enterohemorrhagic E. coli hlyA, rfbO111 and rfbO157. J Clin Microbiol. 1998;36:598–602.PubMedGoogle Scholar
- Kozub-Witkowski E, Krause G, Frankel G, Kramer D, Appel B, Beutin L. Serotypes and virutypes of enteropathogenic and enterohaemorrhagic Escherichia coli strains from stool samples from children with diarrhea in Germany. J Appl Microbiol. 2008;104:403–10.PubMedGoogle Scholar
- Willshaw GA, Smith HR, Cheasty T, Wall PG, Rowe B. Vero cytotoxin-producing Escherichia coli O157 outbreaks in England and Wales, 1995: phenotypic methods and genotypic subtyping. Emerg Infect Dis. 1997;3:561–5. DOIPubMedGoogle Scholar
- Wirth T, Falush D, Lan R, Colles F, Mensa P, Wieler LH, Sex and virulence in Escherichia coli: an evolutionary perspective. Mol Microbiol. 2006;60:1136–51. DOIPubMedGoogle Scholar
- Pearce MC, Chase-Topping ME, McKendrick IJ, Mellor DJ, Locking ME, Allison L, Temporal and spatial patterns of bovine Escherichia coli O157 prevalence and comparison of temporal changes in the patterns of phage types associated with bovine shedding and human E. coli O157 cases in Scotland between 1998–2000 and 2002–2004. BMC Microbiol. 2009;9:276. DOIPubMedGoogle Scholar
- Condon J, Kelly G, Bradshaw B, Leonard N. Estimation of infection prevalence from correlated binomial samples. Prev Vet Med. 2004;64:1–14. DOIPubMedGoogle Scholar
- Food Standard Agency. Comparison of human and cattle E. coli O26 isolates by pulsed field gel electrophoresis (PFGE) [cited 2010 Nov 10]. http://www.foodbase.org.uk/results.php?f_report_id=155
- Bonnet E, Van de Peer Y. zt: a software tool for simple and partial Mantel tests. J Stat Softw. 2002;7:1–12.
- McCune B, Grace JB. Analysis of ecological ecosystems. Glenden Beach (OR): MjM Software Design; 2002.
- Adler D, Murdoch D. rgl: 3D visualization device system (OpenGL). R package version 0.92.798 [cited 2012 Jan 18]. http://CRAN.R-project.org/package=rgl
- Bielaszewska M, Prager R, Kock R, Mellmann A, Zhang W, Tschape H, Shiga toxin gene loss and transfer in vitro and in vivo during enterohemorrhagic Escherichia coli O26 infection in humans. Appl Environ Microbiol. 2007;73:3144–50. DOIPubMedGoogle Scholar
- Mellmann A, Bielaszewska M, Zimmerhackl LB, Prager R, Harmsen D, Tschäpe H, Enterohemorrhagic Escherichia coli in human infection: in vivo evolution of a bacterial pathogen. Clin Infect Dis. 2005;41:785–92. DOIPubMedGoogle Scholar
- Kimmitt PT, Harwood CR, Barer MR. Induction of type 2 Shiga toxin synthesis in Escherichia coli O157 by 4-quinolones. Lancet. 1999;353:1588–9. DOIPubMedGoogle Scholar
- Köhler B, Karch H, Schmidt H. Antibacterials that are used as growth promoters in animal husbandry can affect the release of Shiga-toxin-2-converting bacteriophages and Shiga toxin 2 from Escherichia coli strains. Microbiology. 2000;146:1085–90.PubMedGoogle Scholar
- O’Reilly KM, Denwood MJ, Low JC, Gally DL, Evans J, Gunn GJ, The role of virulence determinants in the epidemiology and ecology of zoonotic E. coli. Appl Environ Microbiol. 2010;76:8110–6.PubMedGoogle Scholar
- Pollock KG, Bhojani S, Beattie TJ, Allison L, Hanson M, Locking ME, Emergence of highly virulent Escherichia coli O26, Scotland. Emerg Infect Dis. 2011;17:1777–9. DOIPubMedGoogle Scholar
- Bettelheim KA. The non-O157 Shiga-toxigenic (Verocytotoxigenic) Escherichia coli; under-rated pathogens. Crit Rev Microbiol. 2007;33:67–87. DOIPubMedGoogle Scholar
Figures
Tables
Cite This ArticleTable of Contents – Volume 18, Number 3—March 2012
| EID Search Options |
|---|
|
|
|
|
|
|
Please use the form below to submit correspondence to the authors or contact them at the following address:
Margo E. Chase-Topping, Centre for Immunity, Infection, and Evolution, University of Edinburgh, Kings Buildings, Edinburgh EH9 3J5, UK
Top