Volume 11, Number 10—October 2005
Research
Mallards and Highly Pathogenic Avian Influenza Ancestral Viruses, Northern Europe
Figure 3

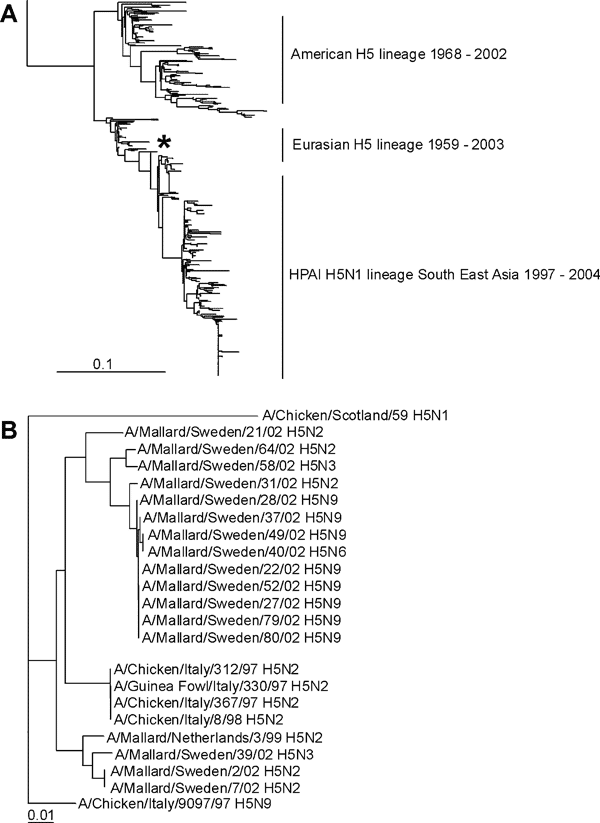
Figure 3. Phylogenetic trees of H5 sequences. A) Phylogenetic tree based on the amino acid sequence distance matrix, representing all H5 amino acid sequences available from public databases. The scale bar represents ≈10% of amino acid changes between close relatives. *Represent location of the H5 influenza A viruses isolated from Mallards. B) DNA maximum likelihood tree for the cluster of European H5 influenza A viruses and the low pathogenic avian influenza H5 influenza A viruses isolated from migrating Mallards by using A/Chicken/Scotland/59 as outgroup. The scale bar represents ≈1% of nucleotide changes between close relatives.
Page created: February 22, 2012
Page updated: February 22, 2012
Page reviewed: February 22, 2012
The conclusions, findings, and opinions expressed by authors contributing to this journal do not necessarily reflect the official position of the U.S. Department of Health and Human Services, the Public Health Service, the Centers for Disease Control and Prevention, or the authors' affiliated institutions. Use of trade names is for identification only and does not imply endorsement by any of the groups named above.