Volume 11, Number 7—July 2005
Dispatch
West Nile Virus Surveillance, Guadeloupe, 2003–2004
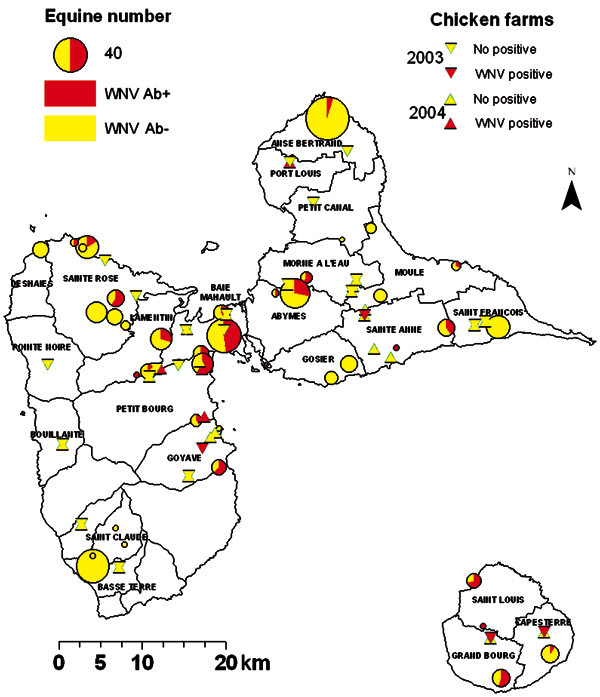
Figure 1

Figure 1. . Results of West Nile virus (WNV) serosurveys in chickens and equines in Guadeloupe, 2003–2004. Equine centers are represented by circles, the sizes of which are proportional to the numbers of equines. The proportion of WNV-seropositive animals is represented in red. Chicken farms are represented by triangles (pointing down for 2003 survey, pointing up for 2004 survey). Red triangles denote farms where at least 1 seropositive chicken was identified. All other farms are denoted by yellow triangles. Ab, antibody.
Page created: April 24, 2012
Page updated: April 24, 2012
Page reviewed: April 24, 2012
The conclusions, findings, and opinions expressed by authors contributing to this journal do not necessarily reflect the official position of the U.S. Department of Health and Human Services, the Public Health Service, the Centers for Disease Control and Prevention, or the authors' affiliated institutions. Use of trade names is for identification only and does not imply endorsement by any of the groups named above.