Volume 12, Number 1—January 2006
Dispatch
Pathogen Transmission and Clinic Scheduling
Figure 1

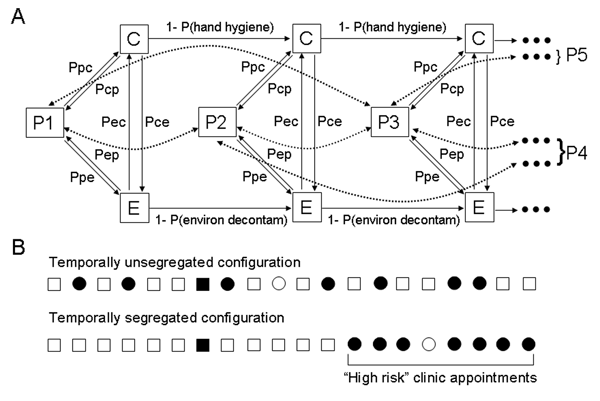
Figure 1. Schematic of model and segregation. A) Depiction of first 3 patient encounters. P1, P2, and P3, patients 1, 2, and 3; C, caregiver; E, environment. Arrows depict path (direction) of transmission if 1 participant in the interaction is infectious or contaminated. P(hand hygiene), probability that a contaminated caregiver will clear his or her contamination between patients; P(environ decontam), probability that a contaminated environment will be effectively decontaminated between patient visits. Direct patient-to-patient transmission is shown by dashed arrows. Because the model treats patient-to-patient transmission as a symmetrical process (the probability of transmission from patient to patient is identical regardless of which of the interacting patients is infectious), dashed arrows have 2 heads. B) Effects of different scheduling strategies. Solid circles, infectious high-risk patients; open circles, noninfectious high-risk patients; solid squares, infectious low-risk patients; open squares, noninfectious low-risk patients. Dots and arrows leading to P4 and P5 represent continuation of the chain of transmission. Ppc, probability of transmission from patient to caregiver; Pcp, probability of transmission from caregiver to patient; Pec, probability of transmission from environment to caregiver; Pce, probability of transmission from caregiver to environment.
CrossRef reports the first author should be "Weinstein" not "Hota" in reference 14 "Hota, 2004".