Volume 12, Number 4—April 2006
Letter
Discrimination between Highly Pathogenic and Low Pathogenic H5 Avian Influenza A Viruses
Figure

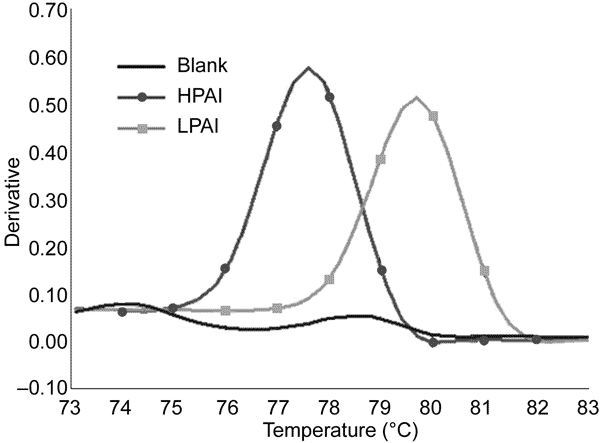
Figure. Discrimination between highly pathogenic avian influenza (HPAI) and low pathogenic avian influenza (LPAI) by melting curve analysis based on real-time reverse transcription–polymerase chain reaction of the H5 HA gene with SYBR Green I fluorescent dye. The melting peaks of HPAI and LPAI were clearly separated. The cutoff value was set at 78.50°C (midpoint between HPAI and LPAI) and used to interpret the pathogenicity of unknown samples.
Page created: January 24, 2012
Page updated: January 24, 2012
Page reviewed: January 24, 2012
The conclusions, findings, and opinions expressed by authors contributing to this journal do not necessarily reflect the official position of the U.S. Department of Health and Human Services, the Public Health Service, the Centers for Disease Control and Prevention, or the authors' affiliated institutions. Use of trade names is for identification only and does not imply endorsement by any of the groups named above.