Volume 12, Number 9—September 2006
Dispatch
Shift in Staphylococcus aureus Clone Linked to an Infected Tattoo
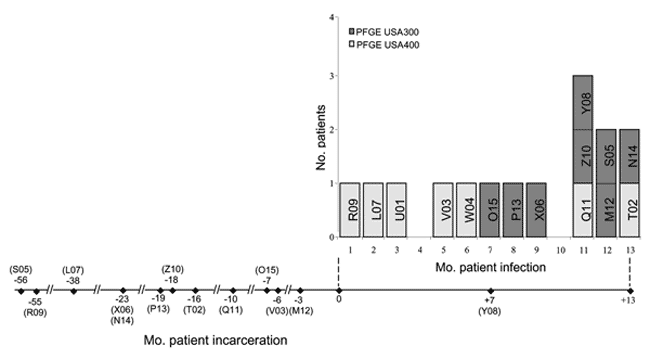
Figure 1

Figure 1. Timeline of incarceration and isolation of methicillin-resistant Staphylococcus aureus isolates from different patients. Top panel: baseline shows months in which a particular isolate was recovered and patient was identified as infected; y-axis shows number of patients in each clonal group per month during the outbreak period. Bottom panel: horizontal line shows duration in which patients were incarcerated in relation to the outbreak period. Month 0 and month numbers with – and + symbols represent the respective months of incarceration before and after onset of the outbreak, respectively. Codes below months represent patients.
Page created: November 17, 2011
Page updated: November 17, 2011
Page reviewed: November 17, 2011
The conclusions, findings, and opinions expressed by authors contributing to this journal do not necessarily reflect the official position of the U.S. Department of Health and Human Services, the Public Health Service, the Centers for Disease Control and Prevention, or the authors' affiliated institutions. Use of trade names is for identification only and does not imply endorsement by any of the groups named above.