Francisella tularensis subsp. tularensis Group A.I, United States
Dawn N. Birdsell, Anders Johansson, Caroline Öhrman, Emily Kaufman, Claudia Molins, Talima Pearson, Miklós Gyuranecz, Amber Naumann, Amy J. Vogler, Kerstin Myrtennäs, Pär Larsson, Mats Forsman, Andreas Sjödin, John D. Gillece, James Schupp, Jeannine M. Petersen, Paul Keim, and David M. Wagner

Author affiliations: Northern Arizona University, Flagstaff, Arizona, USA (D.N. Birdsell, E. Kaufman, T. Pearson, A. Naumann, A.J. Vogler, P. Keim, D.M. Wagner); Umeå University, Umeå, Sweden (A. Johansson); Swedish Defense Research Agency, Umeå (C. Öhrman, K. Myrtennäs, P. Larsson, M. Forsman, A. Sjödin); Centers for Disease Control and Prevention, Fort Collins, Colorado, USA (C. Molins, J.M. Petersen); Center for Agricultural Research, Hungarian Academy of Sciences, Budapest, Hungary (M. Gyuranecz); Translational Genomics Research Institute, Flagstaff (J. Gillece, J. Schupp, P. Keim)
Main Article
Figure 2

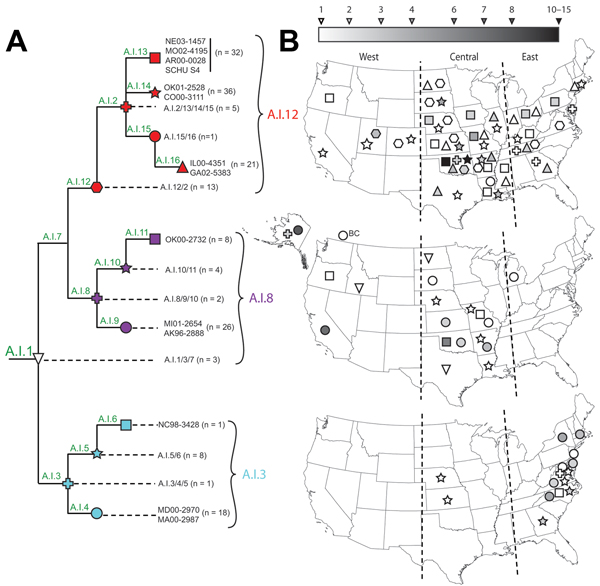
Figure 2. Geographic alignment of 179 geographically diverse Francisella tularensis subsptularensis A.I strains, by subgroup, United StatesA) Canonical single-nucleotide polymorphism (canSNP) topology of 15 intervening and terminal subpopulations defined by screening of 16 canSNPsColors indicate major subgroups within A.I: red, A.I.12; purple, A.I.8; blue, A.I.3Subpopulations are indicated by symbols; n values indicate number of strains assigned to each subpopulationB) Geographic distribution of strains from the 15 subpopulations, shown by corresponding symbols as in panel A and aligned by subgroup (top, A.I.12; middle, A.I.8; bottom, A.I.3)Vertical lines indicate boundaries of the 3 regions: western, central, and easternSubgroups are mapped on the basis of geographic origin at the state levelGradients correspond to number of strains associated with each symbol (i.e., darker symbols indicate a higher number of strains)The basal A.I.1/3/7 subgroup (inverted triangle) cannot be meaningfully assigned to 1 of the 3 main subgroups; thus, this subgroup is arbitrarily represented on the A.I.8 mapBC, British Columbia, Canada.
Main Article
Page created: April 17, 2014
Page updated: April 17, 2014
Page reviewed: April 17, 2014
The conclusions, findings, and opinions expressed by authors contributing to this journal do not necessarily reflect the official position of the U.S. Department of Health and Human Services, the Public Health Service, the Centers for Disease Control and Prevention, or the authors' affiliated institutions. Use of trade names is for identification only and does not imply endorsement by any of the groups named above.
