Volume 6, Number 5—October 2000
Perspective
Using DNA Microarrays to Study Host-Microbe Interactions
Figure 1
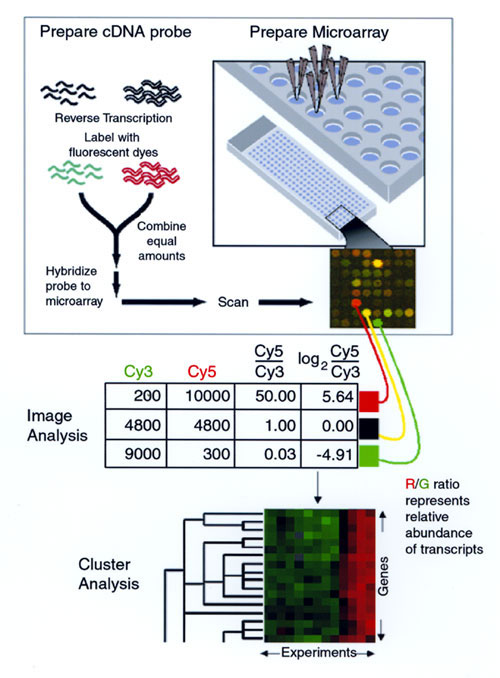
Figure 1. Measuring relative gene expression by using DNA microarrays. Capillary printing is used to array DNA fragments onto a glass slide (upper right). RNA is prepared from the two samples to be compared, and labeled cDNA is prepared by reverse transcription, incorporating either Cy3 (green) or Cy5 (red)(upper left). The two labeled cDNA mixtures are mixed and hybridized to the microarray, and the slide is scanned. In the resulting pseudocolor image, the green Cy3 and red Cy5 signals are overlaid--yellow spots indicate equal intensity for the dyes. With the use of image analysis software, signal intensities are determined for each dye at each element of the array, and the logarithm of the ratio of Cy5 intensity to Cy3 intensity is calculated (center). Positive log(Cy5/Cy3) ratios indicate relative excess of the transcript in the Cy5-labeled sample, and negative log(Cy5/Cy3) ratios indicate relative excess of the transcript in the Cy3-labeled sample. Values near zero indicate equal abundance in the two samples. After several such experiments have been performed, the dataset can be analyzed by cluster analysis (bottom). In this display, red boxes indicate positive log(Cy5/Cy3) values, and green boxes indicate negative log(Cy5/Cy3) values, with intensity representing magnitude of the value. Black boxes indicate log(Cy5/Cy3) values near zero. Hierarchical clustering of genes (vertical axis) and experiments (horizontal axis) has identified a group of coregulated genes (some shown here) and has divided the experiments into distinct classes. (Illustration by J. Boldrick, Stanford University).