Volume 7, Number 4—August 2001
THEME ISSUE
West Nile Virus
West Nile Virus
Dead Crow Densities and Human Cases of West Nile Virus, New York State, 2000
Figure 2
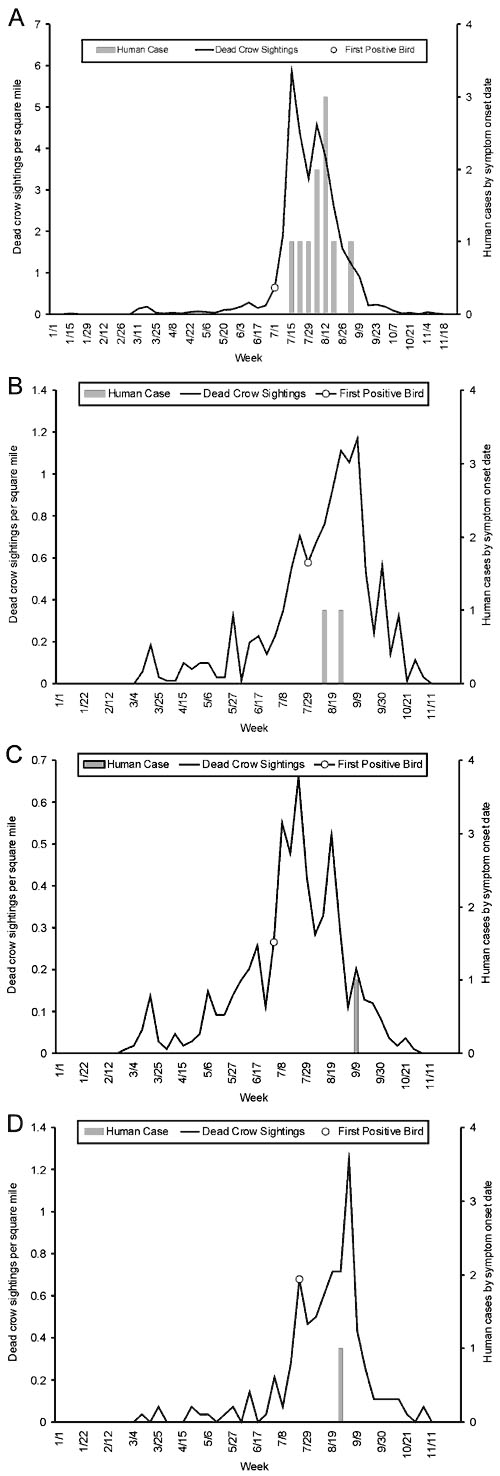
Figure 2. Dead crow density (number of dead crow sightings per square mile) compared with number of human cases, by week. A. Staten Island, axis scale for weekly dead crow density 0 to 7; B. Brooklyn, axis scale for weekly dead crow density 0 to 1.4; C. Queens, axis scale for weekly dead crow density 0 to 0.7; D. Manhattan, axis scale for weekly dead crow density 0 to 1.4.
1Madhu Anand, Rockland County Department of Health; Ada Huang, Westchester County Department of Health; Clare Bradley, Suffolk County Department of Health Services; Angela Pettinelli, Nassau County Department of Health; Kate Schmit, Barbara Wallace, Perry Smith, Geraldine Johnson, Dennis White, Division of Epidemiology, New York State Department of Health; and Kristen Bernard, Alan Dupuis, Gregory Ebel, Susan Jones, Elizabeth Kauffman, Joseph Maffei, Arbovirus Laboratory, New York State Department of Health.