Skip directly to site content Skip directly to page options Skip directly to A-Z link Skip directly to A-Z link Skip directly to A-Z link
Volume 7, Number 5—October 2001
Research

Clinical Consequences and Cost of Limiting Use of Vancomycin for Perioperative Prophylaxis: Example of Coronary Artery Bypass Surgery

Giorgio Zanetti*†Comments to Author , Sue J. Goldie‡, and Richard Platt*§
Author affiliations: *Channing Laboratory, Brigham and Women's Hospital, and Eastern Massachusetts CDC Prevention Epicenter, Boston, Massachusetts, USA; †University Hospital, Lausanne, Switzerland; ‡Harvard School of Public Health, Boston, Massachusetts, USA; §Harvard Medical School and Harvard Pilgrim Health Care, Boston, Massachusetts, USA

Main Article

Figure 3

Determination of the incremental cost-effectiveness ratio of the routine vancomycin strategy relative to the routine cefazolin strategy, according to bacterial resistance pattern. To determine the incremental cost-effectiveness ratio: 1) Place percent incidence of surgical site infection caused by methicillin-resistant Staphylococcus aureus on the a axis; 2) Place percent incidence of surgical site infection caused by methicillin-resistant coagulase-negative staphylococci on the b axis; 3) Draw

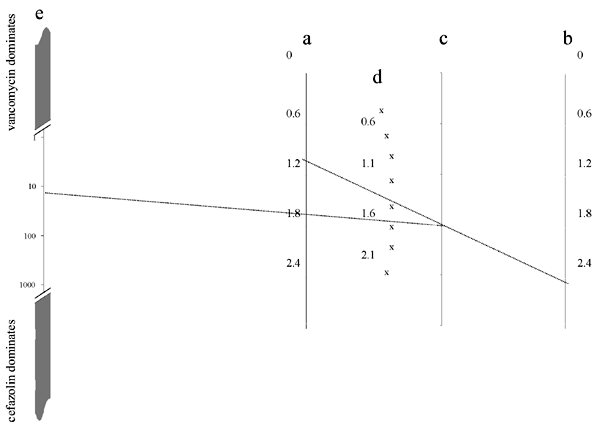
Figure 3. . Determination of the incremental cost-effectiveness ratio of the routine vancomycin strategy relative to the routine cefazolin strategy, according to bacterial resistance pattern. To determine the incremental cost-effectiveness ratio: 1) Place percent incidence of surgical site infection caused by methicillin-resistant Staphylococcus aureus on the a axis; 2) Place percent incidence of surgical site infection caused by methicillin-resistant coagulase-negative staphylococci on the b axis; 3) Draw a line between these 2 points. This line crosses the c axis at a point x; 4) Place percent incidence of surgical site infection caused by cefazolin-susceptible gram-negative bacteria on the scale d; 5) Draw a line passing through this point and the point x on the c axis. If this line crosses the e axis between the two zones of dominance, the incremental cost-effectiveness ratio can be red (in thousands of dollars per additional death or surgical site infection averted). The dotted lines represent the example cited in text.

Main Article

Page created: April 26, 2012
Page updated: April 26, 2012
Page reviewed: April 26, 2012
The conclusions, findings, and opinions expressed by authors contributing to this journal do not necessarily reflect the official position of the U.S. Department of Health and Human Services, the Public Health Service, the Centers for Disease Control and Prevention, or the authors' affiliated institutions. Use of trade names is for identification only and does not imply endorsement by any of the groups named above.
file_external