Volume 8, Number 8—August 2002
Research
Use of Automated Ambulatory-Care Encounter Records for Detection of Acute Illness Clusters, Including Potential Bioterrorism Events
Cite This Article
Citation for Media
Abstract
The advent of domestic bioterrorism has emphasized the need for enhanced detection of clusters of acute illness. We describe a monitoring system operational in eastern Massachusetts, based on diagnoses obtained from electronic records of ambulatory-care encounters. Within 24 hours, ambulatory and telephone encounters recording patients with diagnoses of interest are identified and merged into major syndrome groups. Counts of new episodes of illness, rates calculated from health insurance records, and estimates of the probability of observing at least this number of new episodes are reported for syndrome surveillance. Census tracts with unusually large counts are identified by comparing observed with expected syndrome frequencies. During 1996–1999, weekly counts of new cases of lower respiratory syndrome were highly correlated with weekly hospital admissions. This system complements emergency room- and hospital-based surveillance by adding the capacity to rapidly identify clusters of illness, including potential bioterrorism events.
Rapid identification of unusual clusters of acute illness in the general population is a fundamental challenge for public health surveillance (1). Recent distribution of Bacillus anthracis spores and the resulting occurrence of clinical disease (2) provide new impetus to developing and implementing surveillance systems that can identify both bioterrorism events and naturally occurring illness clusters, such as influenza and waterborne disease. Recognizing individual cases of infection, e.g., inhalational anthrax, requires astute and alert clinicians. However, many potential biological agents of terrorism, including anthrax, have nonspecific prodromal phases, and no explicit diagnosis is ever made for many other syndromes of potential importance. Recognizing these clusters at the earliest possible opportunity will require well-designed surveillance systems to ensure timely detection of unusual clusters of prodromal, nonspecific illness.
Several projects have been developed specifically to provide improved surveillance for detecting bioterrorism in urban populations (3). Some of these existing surveillance systems operate in emergency departments and hospitals (4). While these systems are very useful, implementation may be impeded by the effort required for timely collection and analysis of diagnosis data in a suitable format. Additionally, emergency rooms and hospitals may see increased numbers of cases days after the first, milder symptoms of disease bring new patients to ambulatory-care settings.
Surveillance systems based in ambulatory-care settings, particularly those based on automated medical records, may therefore provide worthwhile additional information. One of the best-known such systems is the Department of Defense Electronic Surveillance System for the Early Notification of Community-based Epidemics (ESSENCE) system (5), which is based on encounter data from health services operated by the Department of Defense. Another such system is operating in Minnesota (6). Nurse hot lines have also been used for surveillance purposes (7).
We describe here an automated system developed in a partnership between the Centers for Disease Control and Prevention, the Massachusetts Department of Public Health, a large group practice, a health plan, and an academic department. The system produces next-day information about illness clusters, based on ambulatory-care visits and telephone calls.
The utility of diagnoses from automated ambulatory encounter data for detecting respiratory disease clusters has been described (8). In this report, we extend the use of encounter data to produce daily surveillance summary reports covering a broad range of syndromes for use by public health officials and health-care providers.
The encounter data come from an electronic medical record system used by Harvard Vanguard Medical Associates, a large multispecialty group practice, to record all ambulatory-care encounters, including telephone contacts, regular visits, and urgent-care encounters, but not emergency room visits. The practice serves approximately 250,000 members, representing approximately 10% of the population of eastern Massachusetts.
The automated record system is a commercial product (Epicare; Epic Systems Corporation, Madison, Wisconsin; available from URL: http://www.epicsys.com) used by many large medical groups. It represents a valuable source of surveillance data because it operates in real time (i.e., records are updated as information is entered). Additionally, to the extent that practices engage in some form of prepaid care, the population served can be explicitly enumerated; the surveillance report described below is restricted to approximately 175,000 members of Harvard Pilgrim Health Care, a principal health maintenance organization in the region. These persons constitute a defined population that receives essentially all its ambulatory care in this practice. Demographic information and addresses are available for all these persons. At the time of consultation, clinical diagnoses are assigned for each encounter by the clinician, who chooses from lists of terms on the encounter screen; essentially all episodes are coded by the end of the same day on which care is given. Although an unlimited number of codes can be chosen, approximately 90% of encounters have three or fewer codes assigned (8), stored as ICD-9 codes. Each night, an extract is created of all encounters recorded in the previous 24 hours with any of >1,500 ICD-9 codes in any of the syndrome categories. The patient's temperature is also recorded along with the ICD-9 codes. Demographic data are merged with each record through a link to the patient’s membership record.
As a way of grouping insured persons into neighborhoods, the addresses of the insured plan members, obtained from the HMO's data, have been coded by Geographic Information System (Mapping Analytics, Rochester, NY) to determine the census tracts of their residences (9,10).
Developing and Defining Syndromes
Patient encounters are categorized into syndrome groups according to the ICD-9 codes assigned at the time of consultation. The surveillance software considers each encounter record in turn and merges related ICD-9 diagnosis codes into syndrome groups by using a modification of a provisional classification scheme developed as part of the ESSENCE project (5). This scheme reduces the complexity of the ICD-9 into eight syndrome categories: coma/shock, neurologic, upper gastrointestinal, lower gastrointestinal, upper respiratory, lower respiratory, dermatologic, and sepsis/fever. We made two major modifications of the syndrome definitions: the number of ambulatory episodes in the coma/shock category was almost zero in 4 years of data we examined, so it was combined with the neurologic syndrome category. A new syndromic category representing diagnoses of Centers for Disease Control and Prevention (CDC) bioterrorism category A agents (11) (anthrax, botulism, plague, smallpox, tularemia, and hemorrhagic fever) is reported separately. We also added an additional influenza-like illness category, defined by the CDC sentinel surveillance definition of fever >37.8oC plus cough and/or sore throat in the absence of a known cause (12).
An individual patient may have multiple encounters associated with a single episode of illness (e.g., initial consultation, consultation 1–2 days later for laboratory results, and follow-up consultation a few weeks later) (8). To avoid double counting from this common pattern of ambulatory care, the first encounter for each patient within any single syndrome group is reported, but subsequent encounters with the same syndrome are not reported as new episodes until >6 weeks has elapsed since the most recent encounter in the same syndrome. We have reported that grouping respiratory illness visits into episodes reduces the total number of events by 38% in this clinical setting (8). This practice of grouping clinical encounters into episodes of illness occurs independently for different syndromes. For example, a patient could qualify for two different syndromes on a single visit if codes for cough (lower respiratory syndrome) and diarrhea (lower gastrointestinal syndrome) are assigned at the same visit; or a lower gastrointestinal syndrome episode could begin a few days after the start of a lower respiratory syndrome episode.
Reporting Results
Figure 1
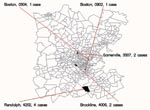
Figure 1. Map of sample small area syndrome counts for Monday, March 4, 2002, showing the five census tracts with the most extreme probability values. Labels show name of town, census tract code...
A daily surveillance summary report (Tables 1 and 2; Figure 1) was designed in collaboration with staff from the Massachusetts Department of Public Health and the medical group's administration, which has operated since it was implemented on October 25, 2001. The aim of the report was to identify any unusually large numbers of episodes of illness within the ambulatory-care system. The current version (Table 1) shows new episode counts and rates (per 1,000 insured persons) for all syndromes combined and for each individual syndrome, during the previous day. Mean rates are presented for the same day of the week in the same month of the previous 2 years, as well as the statistical probability associated with these counts derived from a generalized linear mixed model (described in the Models and Analysis section) for the four most common syndromes.
Each day's report also includes a list and maps of the residence locations of cases with respiratory and gastrointestinal syndromes (Tables 1 and 2; Figure 1). The list and the map both show the five census tracts in the region with the most improbably large number of new episodes, based on the statistical model described. Daily updates are disseminated to authorized persons through a password-protected area on a Secure Sockets Layer (SSL) (13,14) encrypted website.
Models and Analysis
 .
.We also used the model to generate the probability that a count as large or larger than the observed count would be seen over the whole surveillance area, after adjusting for day of week, holidays, season, and census tract variation. This adjustment is done by the same process as for the individual tracts except that the random effects are omitted. These values are also then adjusted on a yearly basis to account for the fact that the probabilities are estimated every day. This estimate is simply the probability that a count as or more extreme as the observed one would be observed in 365 days. All the statistical processing uses automated SAS (18) programs. The web interface was developed by using the Zope web application platform (19), which runs a Python (20) program to rewrite the SAS output files as linked web pages.
Validation
In the absence of known bioterrorism events, one way of validating the surveillance system is to compare the relationship between the substantial seasonal changes in disease incidence known to occur in the ambulatory-care setting (8) to the seasonal pattern in a reliable and independent source of data such as the hospital system. The lower respiratory syndrome includes a range of diseases (8) commonly associated with admission for an acute illness after a variable prodrome, so this syndrome was chosen for comparison.
Figure 3

Figure 3. Health plan membership by census tract in eastern Boston. Each census tract contains approximately 4,000 residents.
Health plan membership is not uniformly distributed throughout the population of Massachusetts (Figure 3). One hundred twenty zip codes were identified in which >100 lower respiratory syndrome episodes were identified in health plan members during 1996–1999; these cases accounted for approximately 70% of all ambulatory lower respiratory syndrome episodes recorded in health plan members.
The weekly numbers of these episodes in health plan members were compared with weekly hospital admissions for all residents (not limited to health plan members) of the same 120 zip codes. Hospital admission data with personal identifiers removed were obtained from the Massachusetts Division of Health Care Finance and Policy for the 3 years ending September 30, 1999. These records included only patients discharged from the hospital, so the final 3 weeks of the hospital admission data were truncated to minimize the “edge effect” from the period when patients may have been admitted but not yet discharged and thus were not included in the available data.
Using the same procedure to group hospital discharge ICD-9 codes as was used for the ambulatory data, we identified all admissions from residents of the 120 zip codes who had a discharge diagnosis in the lower respiratory syndrome group. Hospitalizations were assigned to the date of admission. We compiled the number of ambulatory lower respiratory syndrome episodes and the number of hospital admissions for lower respiratory syndrome for each week for the 3 years ending September 30, 1999. Time-series plots were prepared to compare seasonal patterns in the two independent data sources, and Spearman rank correlations were calculated between weekly hospital admission counts and ambulatory care episodes in the same week, the previous week, and so on up to 6 weeks, by using SAS Proc CORR (18).
Figure 2
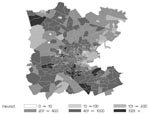
Figure 2. Daily incidence rates of lower respiratory and influenza-like illness after December 17, 2001, showing that within-week variation is substantially greater than seasonal variation.
Data from an example of the summary report, one of the syndrome census tract reports, and the corresponding map for March 4, 2002, are shown in Table 1, Table 2 and Figure 1, respectively. The overall counts were all well within model-based expectations for this time of year, so the associated probabilities were all close to 1; at the level of census tracts, all counts are common enough to be expected daily. Figure 2 shows daily rates of new episodes of influenza-like illness and lower respiratory syndromes. Day-to-day variation is marked, especially on weekends, as is the expected winter increase in rates. Holidays such as New Year’s Day have the lowest rates of reported illness.
The sensitivity of the statistical model in the face of this extreme day-to-day and seasonal variation is illustrated in Table 3. As few as three cases among health plan members may constitute an event predicted by the GLMM to occur less often than once per year, depending on the day of week and the month of the year.
Figure 4
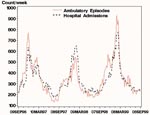
Figure 4. Weekly total ambulatory-care episodes of lower respiratory syndrome (broken line) and hospital admissions for lower respiratory syndrome (solid line) in Massachusetts for the 3 years from September 9, 1996, through September...
Visual inspection of the weekly counts of episodes in the ambulatory setting compared with hospital admissions shows congruent patterns, including pronounced winter peaks (Figure 4). The data for admissions appear to lag behind data for ambulatory-care visits, most obviously for the winters of 1997 and 1999. Overall, weekly ambulatory-care episodes for lower respiratory illness were highly correlated with hospital admissions over the 3 years examined. The Spearman rank correlation between hospital admissions and ambulatory-care visits during the same week was 0.89. Correlating hospital admissions with ambulatory encounters from the previous week yielded a value of 0.90. Repeating this analysis, increasing the lag by 1 week at a time up to 6 weeks, yielded correlations of 0.92 at 2 weeks, 0.89 at 3 weeks, 0.85 at 4 weeks, 0.80 at 5 weeks, and 0.76 at 6 weeks.
The approach we have taken in the syndrome reporting system is to try to maximize the probability that any “signal” from the earliest stages of a bioterrorism or other public health event can be detected above the “noise” of normal clinical practice. The principal value of a syndromic surveillance system like the one described here is its ability to identify clusters of illness manifest by an unusual number of events, none of which individually differs appreciably from common respiratory, gastrointestinal, or other illnesses. Such nonspecific presentations might be the first sign of a widespread bioterrorism attack. They may also be the only routinely available clinical evidence of other important illness clusters, such as influenza or cryptosporidiosis, for which specific diagnostic tests are typically not performed. Even commonly available tests, such as x-rays, leukocyte counts, and sputum cultures are often not performed for lower respiratory illness with fever in an otherwise healthy patient, so syndromic surveillance can complement surveillance for individual cases of severe or unanticipated illness, which depend on detailed information about history, signs, symptoms, and diagnostic testing. Both syndromic and disease-specific surveillance systems are important components of any complete public health system.
To provide the best possible opportunities for effective intervention, an ideal surveillance system should gather timely, valid, and inexpensive data from a sufficiently large proportion of the population to detect events of interest in the region, and then process and present it to public health personnel in a form that enables efficient decision making. Important elements of such a syndromic surveillance system exist in the automated data generated by health plans and other parts of the health-care delivery system as part of routine operations. The system described here meets many of these criteria because it results from collaboration between academic investigators, health-care providers, and public health officials.
The automated medical records used here are well suited for surveillance of ambulatory-care encounters because the system is deeply integrated into the daily work of all clinicians and it is linked to both the provider payment and the membership systems. Although the data used in this system originate in a complete electronic medical record system, most of the syndromes are defined by diagnosis codes that are also available in other automated systems, including nurse hot lines and increasingly common same-day financial claims processing systems. Thus, several different kinds of data sources could contribute to an integrated surveillance network.
Time-series plots (Figure 4) provide some evidence that the data have validity as a measure of illness in the community, since the seasonal pattern is comparable with that in independently collected and validated hospital admission records for the same geographic region. The highest correlation, 0.92 at 2 weeks lag, implies that up to 85% of the variability of weekly hospital admission rates is predicted by variation in ambulatory-care admission levels 2 weeks earlier.
Although the principal focus of this system is identifying unusual patterns of apparently common conditions, it also ensures prompt reporting of any encounter with a diagnosis suggestive of a CDC category A bioterrorism agent. In practice, any clinician making one of these diagnoses would be likely to report such a case separately, but there is almost no marginal cost to implement or run this additional surveillance component.
The unadjusted counts and rates for each syndrome (Table 1) may be most useful in responding to a very large and widespread bioterrorism event or identifying expected events such as the advent of influenza in a community. In these cases, statistical refinement is unnecessary because those monitoring the system will see substantially elevated rates. We believe statistical inference will be most useful when the signal from an event is weak or restricted to a small geographic region. Many syndromes have large seasonal fluctuations, such as the well-known winter peak for lower respiratory disease. Individual census tracts also show substantial variability in daily syndrome episode rates, possibly associated with demographic and socioeconomic differences. The statistical model adjusts daily expectations to account for important sources of variation, so those parts of the report based on statistical models take large "expected" seasonal increases in illness into account (e.g., Figure 4). The sensitivity of the resulting system (Tables 1 and 2) in the face of expected variability appears to be much higher than more commonly advocated time-series based analytic approaches for public health surveillance (21).
Daily counts for each syndrome within single census tracts are usually zero, and as few as three to five health plan members affected would be unusual in a typical tract, depending on the month and day of week (Tables 1 and 2). To allow a rapid assessment of the distribution of illness in the region, we highlight the five extreme census tract counts for each syndrome in our daily reports, even though there is nothing unusual in any census tract on most days. An alerting system could easily be triggered when there is a sufficiently unusual cluster for any syndrome. The thresholds can be different for different syndromes, and they can be adjusted to accommodate any desired frequency of alerts. For example, in the absence of a period of heightened alert, public health authorities may wish to be notified when the daily count of syndrome episodes within any census tract attains a level that would only be expected to occur within the entire catchment area once every three or more months. Thus, users will be able to adjust the notification system to suit their needs in terms of the preferred balance of false-positive alerts against the risk of false negatives (no alert in the presence of an actual event of interest). This kind of information, which is being developed as part of this project, could be a useful supplementary source for other public health surveillance systems.
This reporting system includes strong protections of the privacy of individual patients’ health records, since routine reports contain only aggregated information. Existing clinical and administrative security protocols that control statutory or other authorized access to confidential patient data will apply when follow-up is requested by public health authorities.
One advantage of this system is that it takes advantage of the experience of ambulatory-care clinicians, who are likely to be among the first to encounter patients during the prodrome of any potential bioterrorism-related or other acute illness. In addition, the system imposes no additional reporting burden on clinicians, thus ensuring unbiased ascertainment of syndromes of interest that come to the attention of the practice. The data used here are already being gathered as part of the day-to-day practice of all participating clinicians. There is an initial cost for a system of this type because obtaining the data in a suitable form requires initial programming and testing, but subsequent processing requires relatively little additional expenditure and adds substantial value. All the technology used is widely available and inexpensive.
While any simplification inevitably hides some potentially important detail, we believe that in addition to making the reports more comprehensible, grouping the ICD-9 codes decreases the impact of variation in coding practices. This effect is particularly important since the earliest manifestations of an outbreak may be nonspecific. The fact that syndromic surveillance focuses on unusual counts of common events means that detection of a signal may not be greatly influenced by intensity of diagnostic testing performed, completeness of documentation in the medical record, or variation between physicians or health-care systems in the use of diagnostic terminology or assignment of ICD-9 codes. For example, we have shown that >90% of lower respiratory illness episodes are represented by only three of the 119 ICD-9 diagnosis codes included in the lower respiratory illness syndrome (8). As new ICD coding schemes are adopted, changes to the mapping used to translate code into syndrome will be required, but variation among tens of thousands of discrete individual codes is unlikely to have any major impact at the level of the broad syndromes used in our system.
This emphasis on broad groupings of diagnoses also supports the notion that different data sources, including automated medical records, nurse call centers, and transaction data, might be combined into an integrated surveillance system. Because the focus is on the acute illness that prompts a medical encounter, we expect that the performance characteristics will not be seriously affected by differences between automated data systems, for instance, in the number of diagnoses captured or in the method of assigning diagnosis codes. However, experience with additional systems will be required to elucidate these issues. To the extent that different systems yield similar discrimination of events of interest, it will be possible to integrate them at the regional level, to improve overall sensitivity, and at the national level, to allow coherent surveillance of the entire population.
While many types of data systems can contribute valuable surveillance information, appreciating the added value of more sophisticated data sources is also important. For instance, the availability of temperatures in the automated medical record system described here allows automated surveillance for influenza-like illness. The availability of automated laboratory test results and free text also provides opportunities to detect a wider array of conditions and to improve the specificity of detection of acute illness clusters. For example, anthrax surveillance might be limited to patients with fever and a lower respiratory illness syndrome.
An additional noteworthy feature of surveillance systems such as this one is the fact that they need not cover the entire population to identify at least some clusters of interest. The minimum proportion of the population that must be under surveillance to detect clusters of different sizes has not been determined, but our coverage of 5%-10% of the population of the region appears to provide useful information. Although a small fraction of ambulatory-care practices uses automated medical records, the effective population that would be covered by surveillance systems based on these automated records is substantial, including many of the major population centers in the country. Combining information from these sites with other information sources, such as those maintained by health plans or by hospitals, would rapidly provide at least some monitoring capability for a much larger overall population.
We can suggest additional methods for supplementing a surveillance system that counts syndromes encountered in ambulatory-care visits. Other sources of data, such as school and work absenteeism, over-the-counter medication sales, and even sales of products such as facial tissues and orange juice might contain potentially useful surveillance information. However, whether such data can be cheaply and efficiently gathered and processed and whether the data will yield valid and worthwhile signals remain to be demonstrated.
Many aspects of the current system will be improved with experience. The development of standardized grouping of ICD codes into syndromes is a priority to allow uniform reporting. A great deal of work remains in developing statistical methods capable of detecting different types of illness clusters, ranging from acute, localized increases (for instance, due to release of a toxic chemical agent) to more slowly emerging, widespread conditions, as might be expected from contamination of a water supply. The implementation described here demonstrates that existing electronic data developed in the course of routine medical care by a wide array of providers and health plans can yield substantial improvements in current public health capabilities for assessment of bioterrorism and other acute illness clusters.
We used this SAS code in fitting the generalized linear mixed model (GLMM) that generates the parameter estimates used in our reports. This SAS code relies on the GLIMMIX macro (17), which has been distributed by SAS (18) since version 6.12.%glimmix (data=test,procopt= noclprint covtest ,stmts=%str(class tract month dayofweek;model lri/pop=month dayofweek holiday day;random int/subject=tract solution type=un;),error=binomial);
The data set is structured to contain a row for each day in the historical period for each census tract. In the code, lri is the variable that contains the count for census tract tract on day day. Pop contains the number of subjects in the tract on that day. Month is the month of the day, dayofweek is the day of week of the day, and holiday indicates whether the day is a national holiday. Days are standardized to prevent numerical difficulties with computation.
Dr. Lazarus is visiting associate professor of medicine at Harvard, on leave from the Faculty of Medicine at the University of Sydney, Australia. He is an epidemiologist and information scientist, currently working on bioinformatics research and development in public health surveillance and in genome science at Harvard’s Channing Laboratory.
Acknowledgments
We thank J. Pavlin, Department of Defense Global Emerging Infections System, for providing access to the ESSENCE project.
This project was supported by Grant Award U90/CCU116997 from the Centers for Disease Control and Prevention/Massachusetts Department of Public Health Public Cooperative Agreement for Health Preparedness and Response for Bioterrorism.
References
- Baxter R, Rubin R, Steinberg C, Carroll C, Shapiro J, Yang A. Assessing core capacity for infectious disease surveillance. Falls Church (VA): The Lewin Group, Inc., prepared for: Office of the Assistant Secretary for Planning and Evaluation, Department of Health and Human Services; November 1, 2000.
- Centers for Disease Control and Prevention. Update: investigation of anthrax associated with intentional exposure and interim public health guidelines, October 2001. MMWR Morb Mortal Wkly Rep. 2001;50:889–93.PubMedGoogle Scholar
- Wagner M, Tsui F-C, Espino J, Dato V, Sittig D, Caruana R, The emerging science of very early detection of disease outbreaks. J Public Health Manag Pract. 2001;7:50–8.
- Brinsfield K, Gunn J, Barry M, McKenna V, Dyer K, Sulis C. Using volume-based surveillance for an outbreak early warning system. Acad Emerg Med. 2001;8:492.
- U.S. Department of Defense. Annual report, fiscal year 1999. Silver Spring (MD): Walter Reed Army Institute of Research; 1999.
- Martinez B. Questions of security: healthpartners use reach, speedy data to hold watch for bioterrorism attacks. Wall Street Journal 2001 Nov 1, 2001;Sect. A:10.
- Rodman J, Frost F, Jakuboski W. Using nurse hot lines for disease surveillance. Emerg Infect Dis. 1998;4:329–32.PubMedGoogle Scholar
- Lazarus R, Kleinman K, Dashevsky I, DeMaria A, Platt R. Using automated medical records for rapid identification of illness syndromes: the example of lower respiratory infection. BioMed Central Public Health. 2001;1:1–9.PubMedGoogle Scholar
- US Census Bureau. Geographic areas reference manual, chapter 10: census tracts and block numbering areas. Available from: URL: http://www.census.gov/geo/www/garm.html
- Diez-Roux AV, Nieto FJ, Muntaner HA, Comstock GW, Shahar E, Cooper LS, Neighborhood environments and coronary heart disease: a multilevel analysis. Am J Epidemiol. 1997;146:48–63.PubMedGoogle Scholar
- Centers for Disease Control and Prevention. Biological and chemical terrorism: strategic plan for preparedness and response. MMWR Morb Mortal Wkly Rep. 2000;49(RR-4):1–14.PubMedGoogle Scholar
- Centers for Disease Control and Prevention. Detection and control of influenza outbreaks in acute-care facilities. Available from: URL: http://www.cdc.gov/ncidod/hip/INFECT/flu_acute.htm
- Breslow NE, Clayton DG. Approximate inference in generalized linear mixed models. J Am Stat Assn. 1993;88:9–25. DOIGoogle Scholar
- Kleinschmidt I, Sharp B, Clarke G, Curtis B, Fraser C. Use of generalised linear mixed models in the spatial analysis of small-area malaria incidence rates in KwaZulu Natal, South Africa. Am J Epidemiol. 2001;153:1213–21. DOIPubMedGoogle Scholar
- Brown J. GLIMMIX macro. In: 8.0 ed. Cary (NC): SAS Institute; 1992. Available from: URL: http://ewe3.sas.com/techsup/download/stat/glmm800.sas
- Statistical Analysis System. SAS PC, Version 8. Cary (NC): SAS Institute; 2000.
- Zope Corporation. Z Objects Programming Environment. Fredericksburg (VA): Zope Corporation, 2002. Available from: URL: http://www.zope.org
- Rossum Gv. Python: Stichting Mathematisch Centrum, Amsterdam, The Netherlands; 1990. Available from: URL: http://www.python.org
- Williamson G. Hudson. A monitoring system for detecting aberrations in public health surveillance reports. Stat Med. 1999;18:3283–98. DOIPubMedGoogle Scholar
Figures
Tables
Cite This ArticleTable of Contents – Volume 8, Number 8—August 2002
| EID Search Options |
|---|
|
|
|
|
|
|
Please use the form below to submit correspondence to the authors or contact them at the following address:
Ross Lazarus, Channing Laboratory, 181 Longwood Ave, Boston, MA 02115, USA; fax: 617-525-0958;
Top