Volume 10, Number 4—April 2004
Research
Dengue Spatial and Temporal Patterns, French Guiana, 2001
Annelise Tran* , Xavier Deparis†, Philippe Dussart†, Jacques Morvan†, Patrick Rabarison†, Franck Remy‡, Laurent Polidori*, and Jacques Gardon†
Figure 6
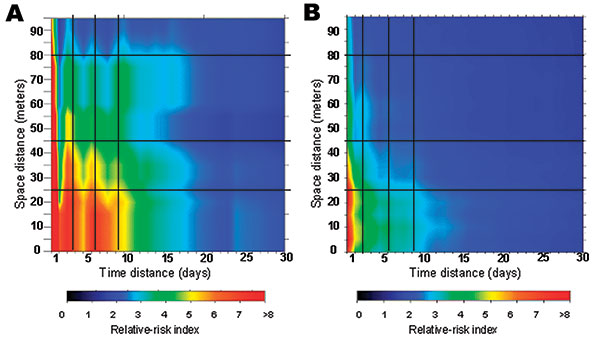
Figure 6. Main risk area for dengue fever (within 100 m and 30 days’ boundaries), derived from laboratory-positive cases data (a) and all suspected cases data (b). Vertical dark lines indicate an apparent temporal periodicity, and horizontal dark lines correspond to apparent spatial breaks.
Page created: February 09, 2011
Page updated: February 09, 2011
Page reviewed: February 09, 2011
The conclusions, findings, and opinions expressed by authors contributing to this journal do not necessarily reflect the official position of the U.S. Department of Health and Human Services, the Public Health Service, the Centers for Disease Control and Prevention, or the authors' affiliated institutions. Use of trade names is for identification only and does not imply endorsement by any of the groups named above.