Volume 10, Number 5—May 2004
Research
Ring Vaccination and Smallpox Control
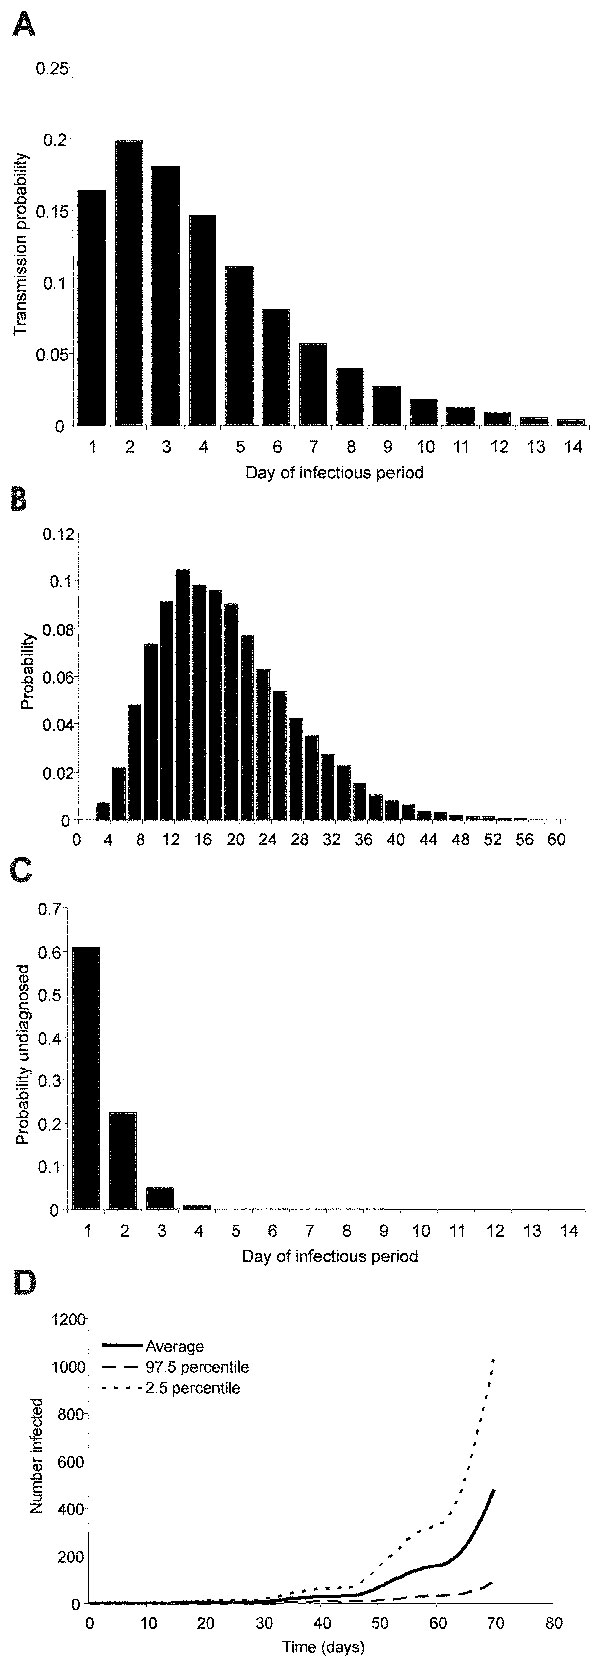
Figure 1

Figure 1. A, the transmission probability per contact by day of the infectious period; B, the probability distribution of the number of contacts with susceptible persons per day; C, the probability of remaining undiagnosed but infectious case by day of the infectious period; and D, the mean (solid line) and the 2.5% and 97.5% percentiles (dotted lines) of the number of infected persons for 500 simulation runs for an epidemic without any intervention after the introduction of one index case at the beginning of this incubation period at t=0.
Page created: February 18, 2011
Page updated: February 18, 2011
Page reviewed: February 18, 2011
The conclusions, findings, and opinions expressed by authors contributing to this journal do not necessarily reflect the official position of the U.S. Department of Health and Human Services, the Public Health Service, the Centers for Disease Control and Prevention, or the authors' affiliated institutions. Use of trade names is for identification only and does not imply endorsement by any of the groups named above.