Volume 10, Number 6—June 2004
Dispatch
Enhancing West Nile Virus Surveillance, United States
Figure 1

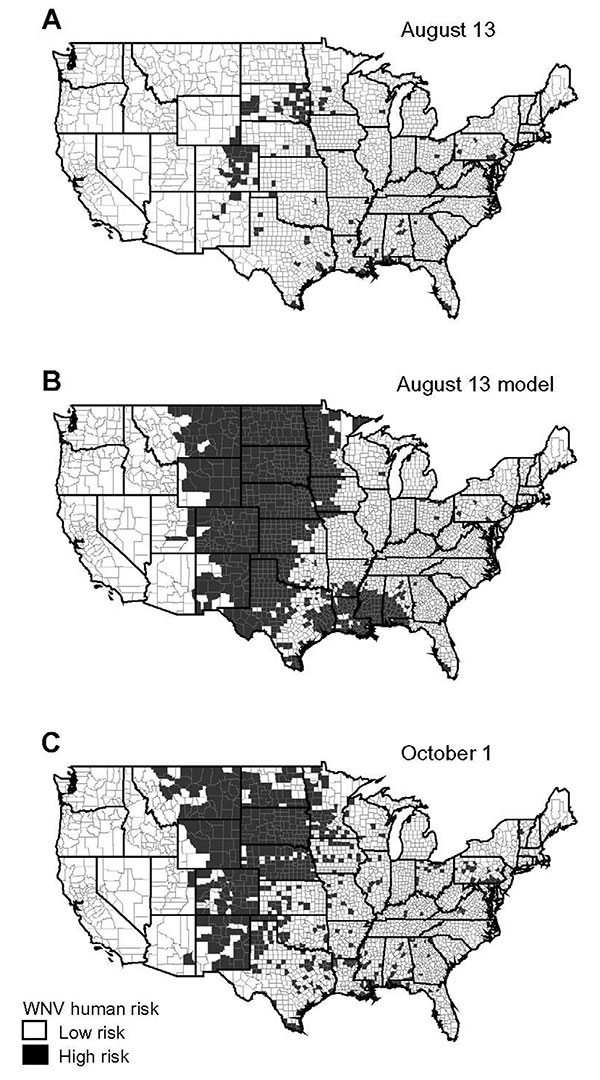
Figure 1. (A) Human incidence map for West Nile virus (WNV) early in the transmission season, 2003, based on raw data. Incidence rates were calculated by using the number of new human cases of WNV per county through August 13, 2003, reported to the ArboNet surveillance network. High risk is defined as incidence >1 case per 1 million inhabitants. (B) Model-estimated human incidence map for WNV in 2003. Expected risk was derived from the observed incidence rates from August 13, 2003. High risk is defined as incidence >1 case per million persons. (C) Observed human risk for WNV late in the transmission season, 2003. Incidence rates were calculated by using the number of new human cases of WNV per county through October 1, 2003. High risk is defined as incidence >1 case per 100,000. This risk surface served to compare the predictive ability of the (A) raw versus (B) modeled early season disease maps.