Volume 10, Number 6—June 2004
Dispatch
Enhancing West Nile Virus Surveillance, United States
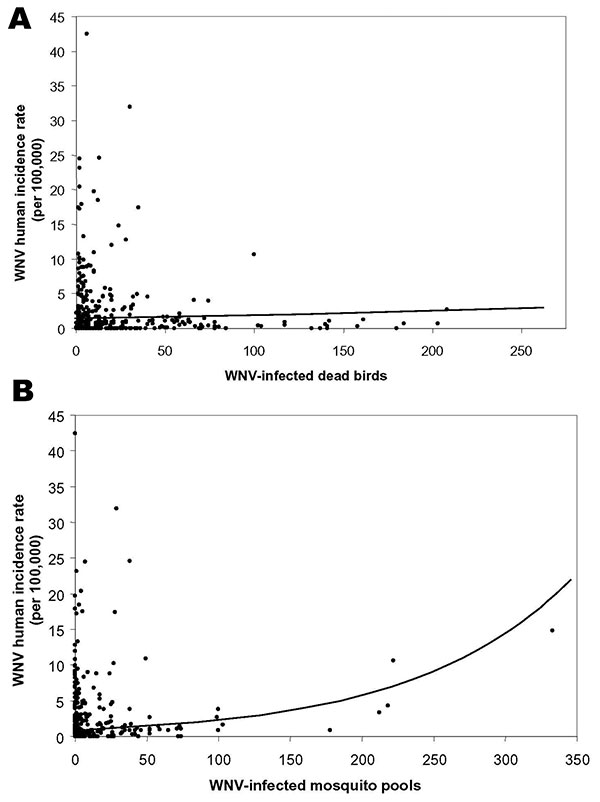
Figure 2

Figure 2. Plots of West Nile virus (WNV) incidence by collections of virus-positive dead birds and virus-positive mosquito pools. Log linear models fit to both surveillance systems considered alone are displayed. WNV-infected dead birds explain 2.5% of the variation in human incidence, whereas WNV-infected mosquito pools explain 38%.
Page created: February 22, 2011
Page updated: February 22, 2011
Page reviewed: February 22, 2011
The conclusions, findings, and opinions expressed by authors contributing to this journal do not necessarily reflect the official position of the U.S. Department of Health and Human Services, the Public Health Service, the Centers for Disease Control and Prevention, or the authors' affiliated institutions. Use of trade names is for identification only and does not imply endorsement by any of the groups named above.