Volume 13, Number 1—January 2007
Dispatch
Human Subcutaneous Dirofilariasis, Russia
Laura H. Kramer* , Vladimir V. Kartashev†, Giulio Grandi*, Rodrigo Morchón‡, Sergei A. Nagornii§, Panagiotis Karanis¶, and Fernando Simón‡
Figure 2
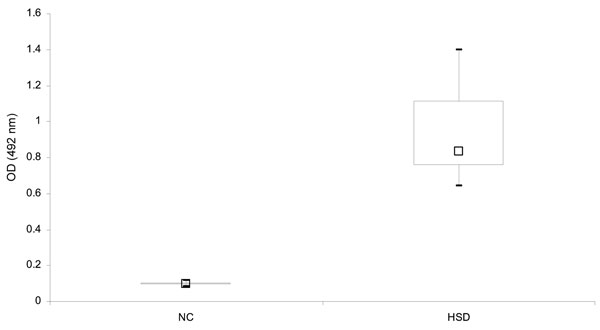
Figure 2. Serologic analysis (box and whisker plot) for antibodies to Dirofilaria repens somatic antigen from normal controls (NC) and patients with human subcutaneous dirofilariasis (HSD). The horizontal line shows the optical density (OD) values of 25–75% of the examined sera. The large box shows OD values between the first and third quartiles, the small box shows the median, and error bars show maximum and minimum OD values. A positive antibody response was defined as an OD value greater than the mean value ±3 standard deviations from 14 normal controls.
Page created: June 28, 2010
Page updated: June 28, 2010
Page reviewed: June 28, 2010
The conclusions, findings, and opinions expressed by authors contributing to this journal do not necessarily reflect the official position of the U.S. Department of Health and Human Services, the Public Health Service, the Centers for Disease Control and Prevention, or the authors' affiliated institutions. Use of trade names is for identification only and does not imply endorsement by any of the groups named above.