Volume 13, Number 1—January 2007
Research
Blood Transfusion and Spread of Variant Creutzfeldt-Jakob Disease
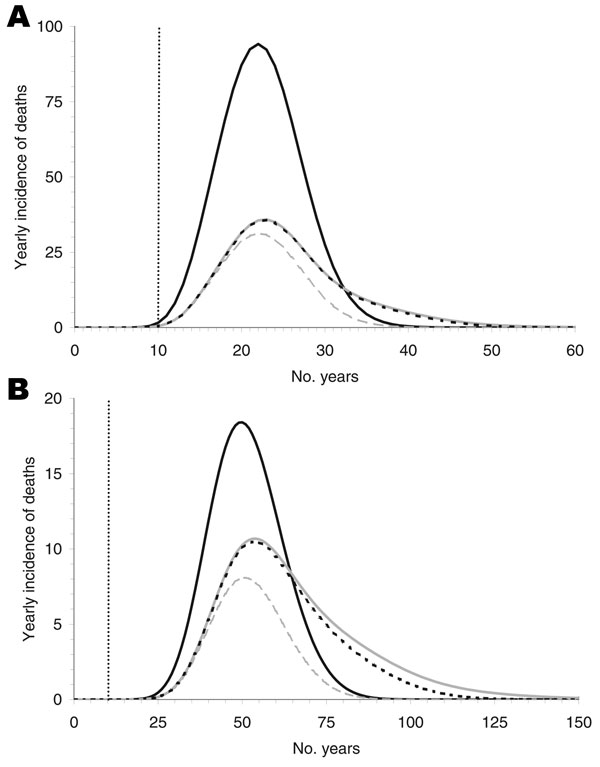
Figure 3

Figure 3. The yearly incidence of deaths for an incubation period of 16 (A) and 50 (B) years. The black curves show nonrecipients of blood transfusion who were infected only by the alimentary route. These curves are independent of the infection probability and the rate of donor exclusion. The lower 3 curves represent the deaths of recipients originating from 0% infectivity of blood transfusions (dashed gray), 100% infectivity without donor exclusion (solid gray), and 100% infectivity of blood transfusions with donor exclusion (dotted black, almost indistinguishable from solid gray line in A). The differences between the solid and dashed gray curves represent the cases due to blood transfusion.
Page created: June 28, 2010
Page updated: June 28, 2010
Page reviewed: June 28, 2010
The conclusions, findings, and opinions expressed by authors contributing to this journal do not necessarily reflect the official position of the U.S. Department of Health and Human Services, the Public Health Service, the Centers for Disease Control and Prevention, or the authors' affiliated institutions. Use of trade names is for identification only and does not imply endorsement by any of the groups named above.