Volume 13, Number 1—January 2007
Research
Blood Transfusion and Spread of Variant Creutzfeldt-Jakob Disease
Klaus Dietz* , Günter Raddatz*, Jonathan Wallis†, Norbert Müller‡, Inga Zerr§, Hans-Peter Duerr*, Hans Lefèvre¶, Erhard Seifried#, and Johannes Löwer**
Figure 5
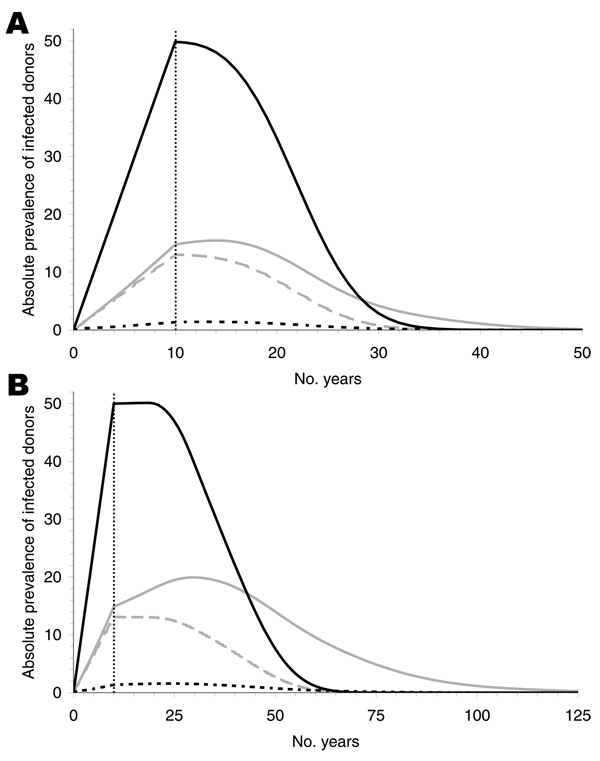
Figure 5. Absolute prevalence of infected donors for an incubation period of 16 (A) and 50 (B) years. The solid black curves show the infected donors without transfusion history. These curves are identical for 0% and 100% infectivity and are independent of donor exclusion. The gray curves show infected donors with transfusion history for 100% (solid) and 0% (dashed) infectivity, respectively, without donor exclusion. The dotted black curves show the effect of donor exclusion starting at the beginning of alimentary risk. Most infected donors have no transfusion history and cannot, therefore, be excluded from blood donation.
Page created: June 28, 2010
Page updated: June 28, 2010
Page reviewed: June 28, 2010
The conclusions, findings, and opinions expressed by authors contributing to this journal do not necessarily reflect the official position of the U.S. Department of Health and Human Services, the Public Health Service, the Centers for Disease Control and Prevention, or the authors' affiliated institutions. Use of trade names is for identification only and does not imply endorsement by any of the groups named above.