Volume 15, Number 4—April 2009
Research
Enhancing Time-Series Detection Algorithms for Automated Biosurveillance
Jerome I. Tokars , Howard Burkom, Jian Xing, Roseanne English, Steven Bloom, Kenneth Cox, and Julie A. Pavlin
Figure 2
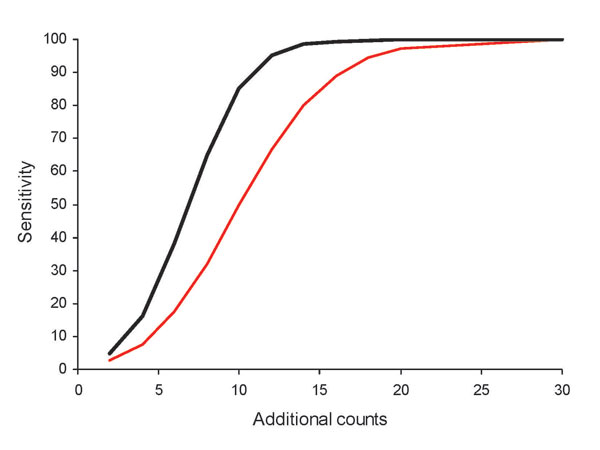
Figure 2. Sensitivity of detecting various numbers of additional counts, by using initial versus best algorithms for hospital emergency department chief complaint data, for selected BioSense data. Red line shows the initial algorithm (minimum SD = 0.2, 7-day baseline, count method, unstratified baseline), and black line shows the best algorithm (minimum SD = 1.0, 28-day baseline, rate method, unstratified baseline).
Page created: December 10, 2010
Page updated: December 10, 2010
Page reviewed: December 10, 2010
The conclusions, findings, and opinions expressed by authors contributing to this journal do not necessarily reflect the official position of the U.S. Department of Health and Human Services, the Public Health Service, the Centers for Disease Control and Prevention, or the authors' affiliated institutions. Use of trade names is for identification only and does not imply endorsement by any of the groups named above.