Volume 15, Number 4—April 2009
Research
Enhancing Time-Series Detection Algorithms for Automated Biosurveillance
Figure 3
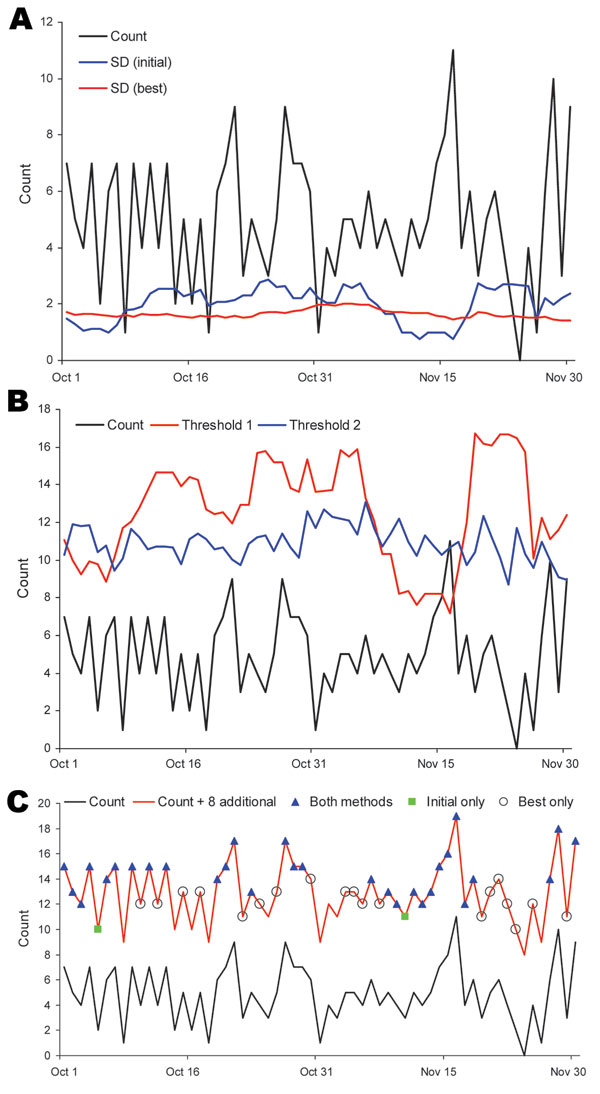
Figure 3. Comparison of initial versus best algorithms for analysis of fever syndrome data at an example emergency department, October–November 2006. A) SD comparison. Count, fever syndrome counts; SD (initial), SD by using initial algorithm (minimum SD = 0.2, 7-day baseline, count method, unstratified baseline); SD (best), SD by using best algorithm (minimum SD = 1.0, 28-day baseline, rate method, unstratified baseline). B) Count threshold comparison. Count, fever syndrome counts; threshold 1, minimum count needed to trigger an alert by using initial method; threshold 2, minimum count needed to trigger an alert by using best method (for the best algorithm, which accounts for rate, 8 counts were added to total visits for calculating the threshold). C) Detection of 8 additional counts. Count, daily fever syndrome counts; count + 8, daily count plus 8 counts; both methods, 30 days with the additional counts detected by both the initial and best methods; initial only, 2 days with the additional counts detected by using initial method only; and best only, 19 days with additional counts detected by using best method only.