Volume 16, Number 7—July 2010
Research
Deforestation and Malaria in Mâncio Lima County, Brazil
Sarah H. Olson , Ronald Gangnon, Guilherme Abbad Silveira, and Jonathan A. Patz
Figure 5
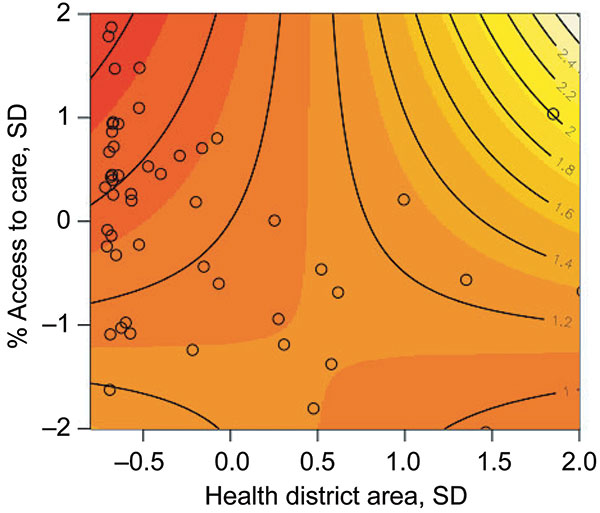
Figure 5. Joint relative risk plot of access to care and health district spatial area, Mâncio Lima, Brazil. Contour lines indicate the joint relative risk for standard deviation changes in percentage access to care and health district spatial area. Open circles are the observed percentage access to care and health district spatial area size data pairs for the 54 health districts. The contour line increment of relative risk is 0.2, increasing with the shading from red to white.
Page created: March 02, 2011
Page updated: March 02, 2011
Page reviewed: March 02, 2011
The conclusions, findings, and opinions expressed by authors contributing to this journal do not necessarily reflect the official position of the U.S. Department of Health and Human Services, the Public Health Service, the Centers for Disease Control and Prevention, or the authors' affiliated institutions. Use of trade names is for identification only and does not imply endorsement by any of the groups named above.