Skip directly to site content Skip directly to page options Skip directly to A-Z link Skip directly to A-Z link Skip directly to A-Z link
Volume 8, Number 11—November 2002
THEME ISSUE
Tuberculosis Genotyping
Tuberculosis Genotyping Network, United States

Spoligologos: A Bioinformatic Approach to Displaying and Analyzing Mycobacterium tuberculosis Data

Jeffrey R. Driscoll*Comments to Author , Pablo J. Bifani†, Barun Mathema, Michael A. McGarry*, Genét M. Zickas*, Barry N. Kreiswirth, and Harry W. Taber*
Author affiliations: *New York State Department of Health, Albany, New York, USA; †Institut Pasteur de Lille, Lille, France; and ‡Public Health Research Institute, New York, New York, USA;

Main Article

Figure 1

Logo analysis on spoligotypes associated with Mycobacterium bovis. The Wadsworth Center database contains 28 unique spoligotypes from strains of M. bovis. Panel A illustrates the raw hybridization data followed by the same patterns coded for logo analysis. To be compatible with WebLogo analysis, patterns were converted to a 43-character–long string consisting of the letters x and o. The letter x represents a positive hybridization, and o represents no hybridization detected for each of the 43 spacer sequences. Panel B is the graphic output from WebLogo. Numbers in each panel represent the spoligotype assay spacer sequences 1–43. Panel C shows the summary graphic of the spoligotypes by collapsing the data into a single row. Legend: x=hybridization observed to spacer, o= no hybridization observed to spacer, ■= positive hybridization in every spoligotype pattern for that individual spacer sequence, □= no hybridization, ●=positive hybridization in >50% of the patterns, ○= no hybridization in >50% of the patterns.

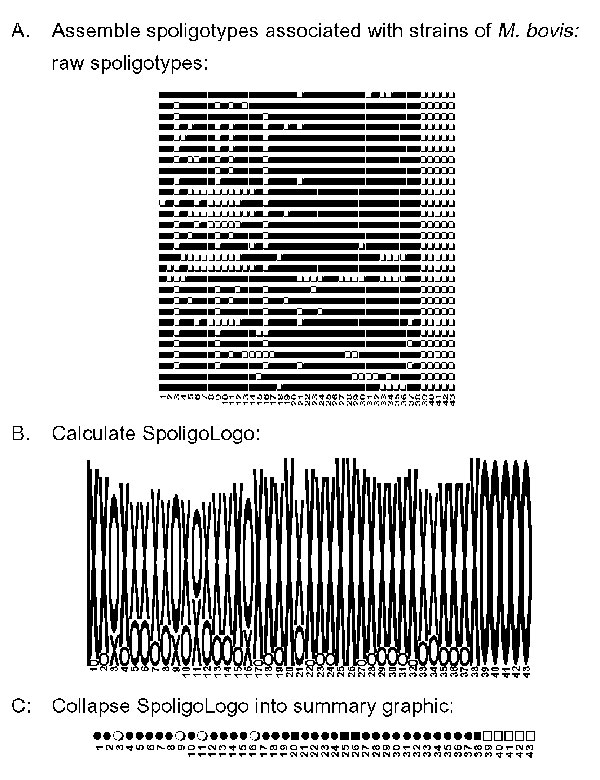
Figure 1. Logo analysis on spoligotypes associated with Mycobacterium bovis. The Wadsworth Center database contains 28 unique spoligotypes from strains of M. bovis. Panel A illustrates the raw hybridization data followed by the same patterns coded for logo analysis. To be compatible with WebLogo analysis, patterns were converted to a 43-character–long string consisting of the letters x and o. The letter x represents a positive hybridization, and o represents no hybridization detected for each of the 43 spacer sequences. Panel B is the graphic output from WebLogo. Numbers in each panel represent the spoligotype assay spacer sequences 1–43. Panel C shows the summary graphic of the spoligotypes by collapsing the data into a single row. Legend: x=hybridization observed to spacer, o= no hybridization observed to spacer, ■= positive hybridization in every spoligotype pattern for that individual spacer sequence, □= no hybridization, ●=positive hybridization in >50% of the patterns, ○= no hybridization in >50% of the patterns.

Main Article

Page created: July 19, 2010
Page updated: July 19, 2010
Page reviewed: July 19, 2010
The conclusions, findings, and opinions expressed by authors contributing to this journal do not necessarily reflect the official position of the U.S. Department of Health and Human Services, the Public Health Service, the Centers for Disease Control and Prevention, or the authors' affiliated institutions. Use of trade names is for identification only and does not imply endorsement by any of the groups named above.
file_external