Volume 8, Number 6—June 2002
Research
Defining and Detecting Malaria Epidemics in the Highlands of Western Kenya
Simon I. Hay*† , Milka Simba†, Millie Busolo‡, Abdisalan M. Noor†, Helen L. Guyatt*†, Sam A. Ochola‡, and Robert W. Snow*†‡
Figure 4
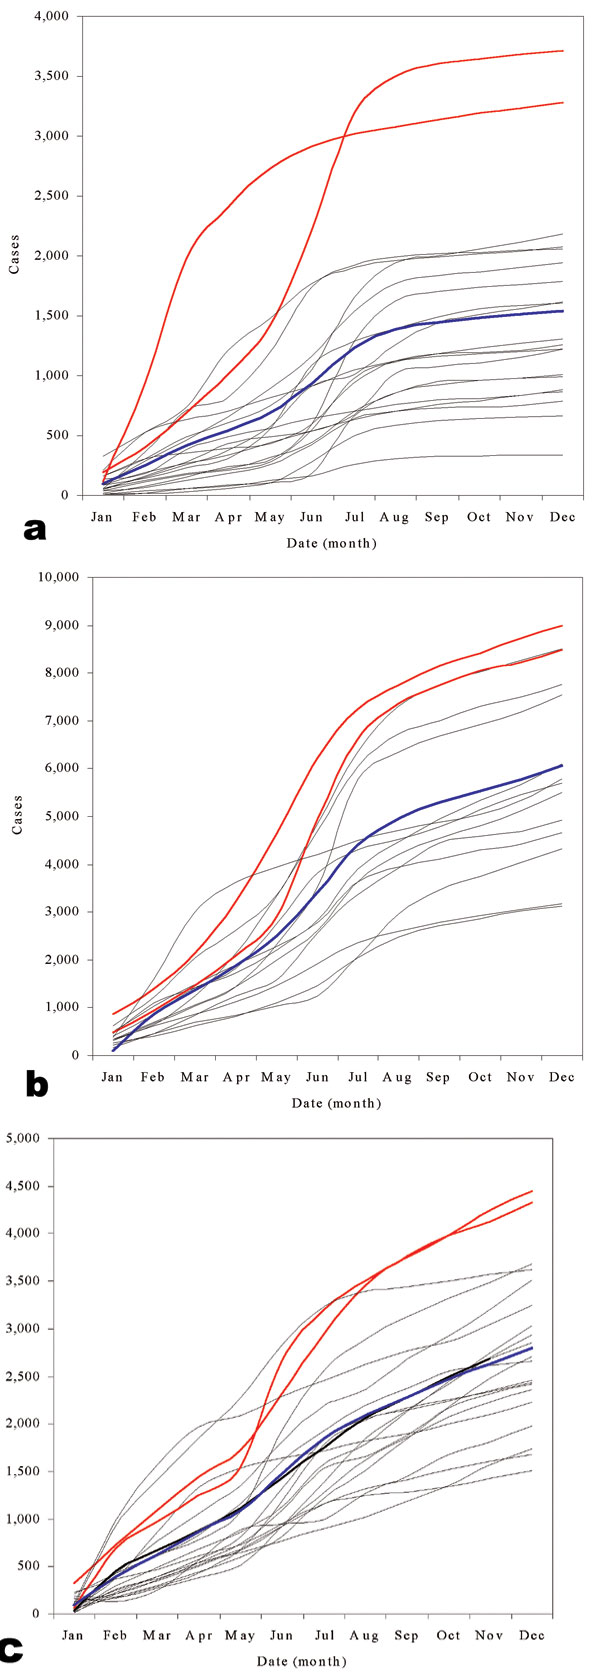
Figure 4. Cumulative case graphs for child admissions in the three hospitals. Cumulative child admissions (<15 years) in Kilgoris (a), Kisii (b), and Tabaka (c). All years for which data were available are shown, 1980-1999, 1987-2000, and 1981-2000 time periods for Kilgoris, Kisii and Tabaka, respectively. Black dashed lines are all “normal” years. The blue line shows mean average cumulative child admissions over all years. Red lines show epidemic years, defined as the 2 years of highest total admissions. For Kilgoris these exceptional years are 1994 and 1998, for Kisii they are 1996 and 1997, and for Tabaka they are 1997 and 1996.
Page created: July 16, 2010
Page updated: July 16, 2010
Page reviewed: July 16, 2010
The conclusions, findings, and opinions expressed by authors contributing to this journal do not necessarily reflect the official position of the U.S. Department of Health and Human Services, the Public Health Service, the Centers for Disease Control and Prevention, or the authors' affiliated institutions. Use of trade names is for identification only and does not imply endorsement by any of the groups named above.