Volume 9, Number 11—November 2003
Research
Human Hantavirus Infections, Sweden
Gert E. Olsson*† , Fredrik Dalerum*1, Birger Hörnfeldt†, Fredrik Elgh†, Thomas R. Palo*2, Per Juto†, and Clas Ahlm†
Figure 5
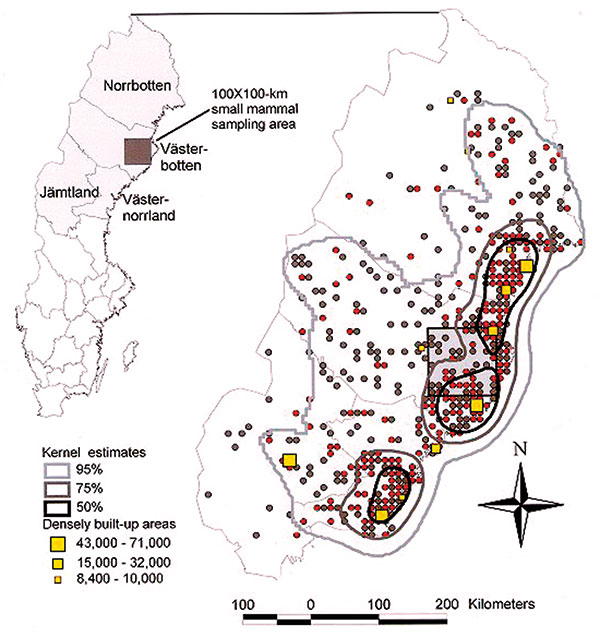
Figure 5. Spatial distribution of nephropathia epidemica infections during 1991 to 1998 in the northern half of Sweden as suggested by patients confident about their site of virus exposure (n = 862). Sites of virus exposure are represented by red (1998 outbreak) and gray dots (remaining years). Densely built-up areas are represented by yellow squares (8,400 to 71,000 inhabitants). Kernel estimates (bold contours) on spatial clustering of cases represent 95%, 75%, and 50% chances of encountering a case among the 862 samples.
Page created: January 24, 2011
Page updated: January 24, 2011
Page reviewed: January 24, 2011
The conclusions, findings, and opinions expressed by authors contributing to this journal do not necessarily reflect the official position of the U.S. Department of Health and Human Services, the Public Health Service, the Centers for Disease Control and Prevention, or the authors' affiliated institutions. Use of trade names is for identification only and does not imply endorsement by any of the groups named above.