Volume 9, Number 6—June 2003
Dispatch
Accidental Infection of Laboratory Worker with Vaccinia
Figure 2
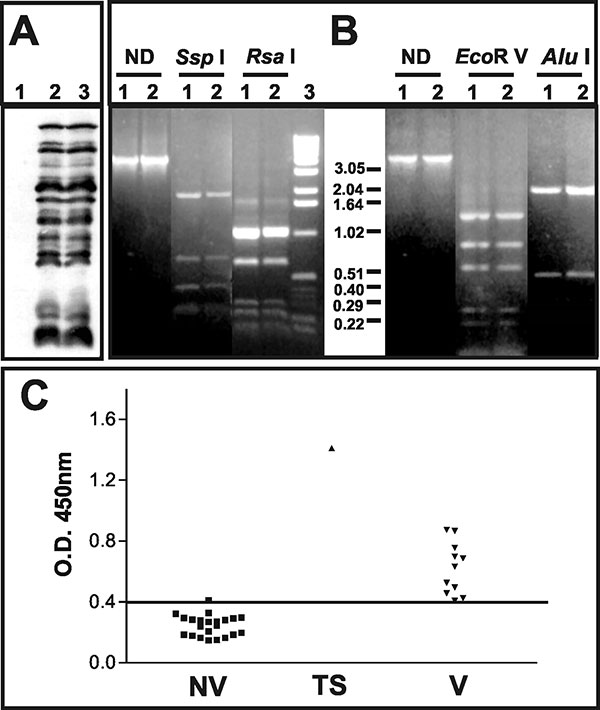
Figure 2. Characterization of the pustular fluid and serologic responses to vaccinia virus antigens. A) Western blot analysis of BSC-40 cells mock-infected (1); infected with vaccinia virus WR (2); or infected with 20 μL of the pustular fluid (3). Molecular weights are expressed in kDa. B) Polymerase chain reaction–restriction fragment length polymorphism analysis of vaccinia virus genome regions. Amplicons corresponding to the A24R gene or the segment between the B9R and B14R genes were digested or not (ND) with the restriction enzymes indicated on the top of the figure. (1) vaccinia virus–WR; (2) clinical sample. C) Detection of vaccinia virus–specific immunoglobulin G antibodies in serum samples from nonvaccinated (NV) and vaccinated persons (V) and the test subject (TS) was performed by enzume-linked immunosorbent assay, and the results are expressed as optical density 450-nm readings. The horizontal bar indicates the cut-off for the test.