Volume 20, Number 11—November 2014
Research
Death Patterns during the 1918 Influenza Pandemic in Chile
Gerardo Chowell , Lone Simonsen, Jose Flores, Mark A. Miller, and Cécile Viboud
Figure 5
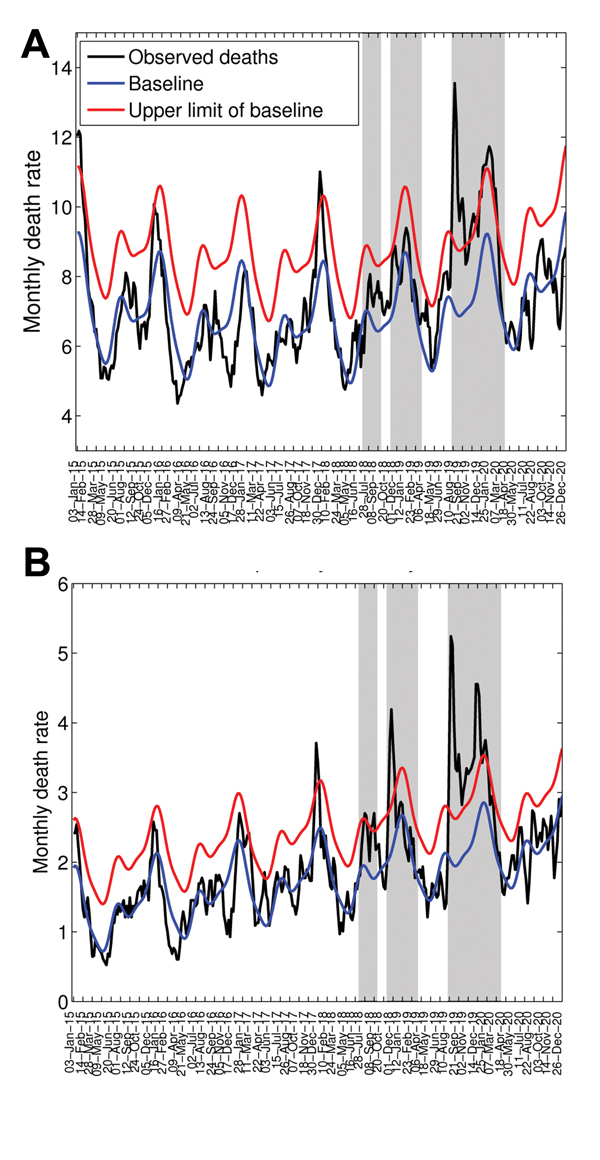
Figure 5. Weekly time series of deaths from all causes (A) and respiratory illness (B) per 10,000 population in Concepción, Chile, 1915–1920 (black lines). Shaded areas highlight 3 periods of high mortality rates associated with 3 waves of the pandemic occurring in July–September 1918, November 1918–March 1919, and August 1919–March 1920. Also shown are the Serfling seasonal regression model baseline (blue lines) and corresponding upper limit of the 95% confidence interval of the baseline (red lines).
Page created: October 17, 2014
Page updated: October 17, 2014
Page reviewed: October 17, 2014
The conclusions, findings, and opinions expressed by authors contributing to this journal do not necessarily reflect the official position of the U.S. Department of Health and Human Services, the Public Health Service, the Centers for Disease Control and Prevention, or the authors' affiliated institutions. Use of trade names is for identification only and does not imply endorsement by any of the groups named above.