Volume 10, Number 1—January 2004
Research
Hospital-reported Pneumococcal Susceptibility to Penicillin1
Figure 2
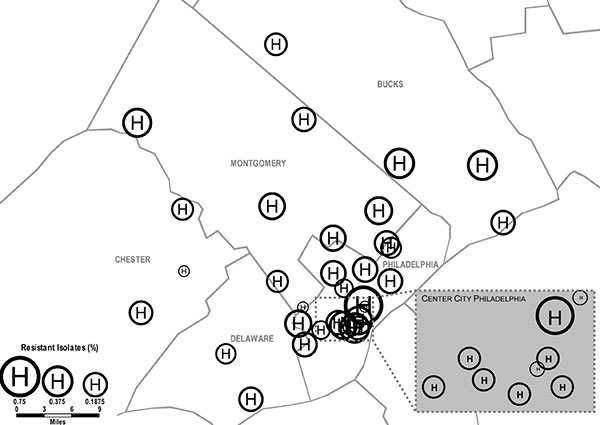
Figure 2. Geographic distribution of penicillin nonsusceptibility among pneumococcal isolates at 33 hospitals in the Delaware Valley in 1998. The figure is a proportional symbol map (bubble plot). Each hospital location is represented by a circle with an H in the center at the corresponding longitude and latitude of the hospital. The radius of the circle is directly proportional to the proportion of penicillin-nonsusceptible pneumococci at each hospital in 1998. The range is 0% to 67%. Hospitals with <10 isolates in 1998 were excluded. An insert magnifies the geographic distribution of hospitals clustered in the center of Philadelphia.
1Presented in part at the 3rd International Symposium on Pneumococci and Pneumococcal Disease, Anchorage, Alaska, May 2002.