Volume 10, Number 10—October 2004
Research
Egg Quality Assurance Programs and Egg-associated Salmonella Enteritidis Infections, United States
Figure 2
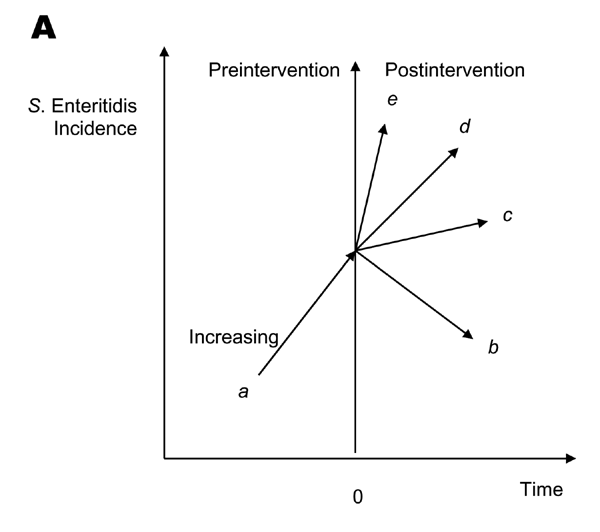
Figure 2. A) Framework to compare Salmonella enterica serovar Enteritidis incidence for a given year to the baseline incidence for evidence of intervention effectiveness. Each arrow shows the change of S. Enteritidis incidence for a given year, relative to baseline incidence. The letter a shows increasing S. Enteritidis incidence relative to the baseline incidence, b shows a reduction in S. Enteritidis incidence relative to the baseline incidence, c shows a smaller reduction, d shows no change, and e shows an increase. B) Framework to compare annualized changes in S. Enteritidis incidence for a given year to a baseline incidence for evidence of effectiveness of an intervention. Each dot represents an annualized change in S. Enteritidis incidence relative to the baseline change in S. Enteritidis incidence, which is 0%. The letter a shows preintervention annualized changes in S. Enteritidis incidence that are above the baseline, indicating annual increase in incidence; b shows postintervention annualized changes in S. Enteritidis incidence that are below the baseline; and preintervention rates indicating annual decrease in incidence; c are above baseline but below preintervention rates; d are above baseline but equal to preintervention rates; and e are above preintervention and baseline rates.