Volume 10, Number 3—March 2004
Research
Correlating Epidemiologic Trends with the Genotypes Causing Meningococcal Disease, Maryland
Cite This Article
Citation for Media
Abstract
Epidemic meningococcal infection is generally caused by single clones; whether nonepidemic increases in infection are clonal is unknown. We studied the molecular epidemiology of meningococcal infection during a period that the incidence increased in two age groups. Serogroup C and Y meningococcal isolates were analyzed by pulsed-field gel electrophoresis and multilocus sequence typing. From 1992 to 1999, 96.4% (27/28) of serogroup C isolates from persons 15–24 years of age were in clonal group 1, compared with 65.6% (21/32) of isolates from persons ≤14 years, and 64.3% (9/14) of isolates from adults ≥25 years (p ≤ 0.01). The proportion of clonal group 2 serogroup Y strains increased from 7.7% (1/13) in 1992 to 1993 to 52.0% (13/25) in 1998 to 1999 (p < 0.01). The nonepidemic age-specific increases in serogroup C meningococcal infection in Maryland were clonal in nature and the changes in serogroup Y incidence were associated with a shift in the genotypes of strains causing invasive disease.
Two important changes occurred in the epidemiology of meningococcal infection in Maryland and other parts of the United States during the 1990s. First, there was a substantial increase and subsequent decline in the incidence of meningococcal infections in persons ages 15 to 24 years in the absence of an epidemic in other age groups; most of the increase was caused by serogroup C infections (1,2). From 1990 to 1997, the incidence increased from 0.9 to 2.1 cases per 100,000 in this age group (p = 0.01) before declining to baseline in the late 1990s. Epidemic meningococcal disease is associated with an increasing incidence in adolescents and young adults and is usually caused by a single clone (3,4). Second, the incidence of meningococcal infection also increased steadily in adults >25 years of age during the 1990s (p = 0.03) (1).
The molecular epidemiology of Neisseria meningitidis infection has historically been characterized by using multilocus enzyme electrophoresis (MEE) (5,6). Due to the complicated nomenclature and labor-intensive nature of electrophoretic type (ET) determination, alternative methods have been pursued. Recently, multilocus sequence typing (MLST) of housekeeping genes has been shown to highly correlate with ET (7). Pulsed-field gel electrophoresis (PFGE) has also been shown to be a useful method for discriminating between sporadic and outbreak strains (8). We sought to determine whether the genotypes of N. meningitidis causing invasive disease correlated with the epidemiologic trends that were observed in Maryland during the 1990s.
Active, laboratory- and population-based surveillance for invasive meningococcal infection from January 1, 1992, to December 31,1999, performed as part of the Maryland Bacterial Invasive Disease Surveillance project (BIDS), was the subject of this analysis (1,9). BIDS is the Active Bacterial Core Surveillance (ABCs) component of the multistate Emerging Infections Program Network coordinated by the Centers for Disease Control and Prevention (CDC) (10). The surveillance case definition was the isolation of N. meningitidis from a normally sterile body fluid from a Maryland resident (1).
Meningococcal serogroups were determined by the Maryland Department of Health and Mental Hygiene Laboratory Administrations and CDC. Serogrouping was repeated on isolates at the Norwegian Institute of Public Health when the PFGE pattern of a particular isolate was genetically more related to isolates of a different serogroup. If discrepant serogroup results were obtained, the serogroup that was most consistent with the isolate’s PFGE pattern was used in the analysis.
PFGE
PFGE was performed as previously described (11). Briefly, equal amounts of bacterial suspension and 2% low-melting agarose (Sea Plaque, FMC Bioproducts, Rockland, ME) were pipetted into plug molds and incubated in ESP buffer (0.5M EDTA, 1% N-lauroyl sarcosine, 1 mg/mL proteinase K; pH 8.5–9.3) overnight at 50°C. After being washed 3 times with TE (Tris 0.5M EDTA) buffer at 37°C, the plugs were restricted with 20 U of NheI (New England Biolabs, Beverly, MA), 330 μg/mL of bovine serum albumin, and 200 μL of New England buffer #2 at 37°C overnight. PFGE was performed in a 1% agarose gel with the following run parameters: 1–30 s for 18 h, 5–9 s for 8 h at 14°C. After the gel was stained with ethidium bromide, the image was digitized on the Bio-Rad Gel Doc 2000 System (Bio-Rad, Hercules, CA). Dendrograms of genetic relatedness were created with Molecular Analyst/Multi-Analyst programs (Bio-Rad) by using the unweighted pair group method with arithmetic averages, and a position tolerance of 1.5%.
The cophenetic correlation, a measure of the correlation between the genetic relatedness represented on the dendrograms and the actual Dice coefficient–derived degree of relatedness, was calculated for the serogroup C and Y dendrograms. A meningococcal clone was defined as isolates with an indistinguishable PFGE pattern. A PFGE-based clonal group was defined as isolates with a ≤3-band difference (12) and/or ≥80% genetic relatedness on dendrogram (8).
MLST
A subset of serogroup C and Y strains, selected to represent the range of PFGE types identified among our isolates, underwent MLST analysis. MLST was performed by using the following seven housekeeping genes (protein products are shown in parentheses): abcZ (putative ATP-binding cassette transporter), adk (adenylate kinase), aroE (shikimate dehydrogenase), fumC (fumarate hydratase), gdh (glucose 6-phosphate dehydrogenase), pdhC (pyruvate dehydrogenase subunit), and pgm (phosphoglucomutase) as previously described (7). The 470-bp fragments were amplified by polymerase chain reaction (PCR) and sequenced using an ABI Prism 377 (PE Applied Biosystems (Foster City, CA) with 5% Long Ranger Gels (FMC Bioproducts, Philadelphia, PA). DNA sequences were determined on both strands. Sequences were assembled with the Auto Assembler DNA Sequence Software Version 2.0 and consensus sequences compared with Sequence Navigator DNA and Protein Sequence Comparison Software (PE Applied Biosystems). Isolates with >5 alleles identical to sequence type (ST)-11 or ST-23 were defined as belonging to ST-11 or ST-23 complex, respectively (available from: http://neisseria.org/nm/typing/mlst/).
Statistical analyses and matrix manipulations were performed using SAS (Version 6.12; SAS Institute; Cary, NC) and R for Windows version 1.5.1 (available from: http://cran.r-project.org). Exact tests were performed using StatXact (Version 4.0.1, Cytel Software Corporation; Cambridge, MA). The Dice coefficients were the basis of the pairwise similarity analysis of the serogroup C isolates. In this analysis, the mean and median Dice coefficients were calculated separately for each age group and time period and the distributions of the Dice coefficients among the groups were compared using the Kruskal-Wallis rank sum test.
During the study period, 295 cases of meningococcal infection were reported (1), of which 258 (87.5%) were available for serogroup determination. Among these 258 isolates, 98 (38.0%) were serogroup Y, 83 (32.2%) were serogroup C, 51 (19.8%) were serogroup B, 12 (4.7%) were serogroup W-135, 2 (0.8%) were serogroup Z, and 1 (0.4%) was serogroup X; 11 (4.3%) could not be identified by serogroup.
Figure 1
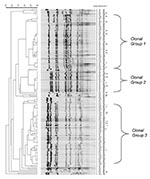
Figure 1. Pulsed-field gel electrophoresis patterns of meningococcal serogroup C strains isolated from persons <15 years of age (panel A), persons 15–24 years (panel B), and adults >25 years of age (panel...
Seventy-seven percent (57/74) of the serogroup C isolates were classified into clonal group 1 by PFGE. The cophenetic correlation for the serogroup C dendrogram was 89.2. There were no other predominant serogroup C clonal groups, and therefore, PFGE patterns not belonging to this clonal group were referred to as nonclonal group 1 strains. Over the 8-year period, 96.4% (27/28) of persons 15–24 years of age were infected with a serogroup C clonal group 1 strain compared with 65.6% (21/32) of persons aged >14 years (p <0.01), and 64.3% (9/14) of adults aged >25 years (p = 0.01). While the incidence was rising from 1992 to 1997 among persons aged 15–24 years, 95% (19/20) of persons in this age group were infected with a clonal group 1 strain compared with 57.7% (15/26) of persons <14 years (p <0.01) and 60.0% (6/10) of adults ∃>25 years (p = 0.03). From 1998 to 1999, the period during which the incidence in those aged 15 to 24 years had returned to baseline, 87.5% (7/8) of the serogroup C isolates from this age group were due to a single clone of clonal group 1 (Figure 1). This clone was only detected in 1999 among persons aged 15–24 years, including an outbreak of three cases (13). Another outbreak, which occurred in 1997 and consisted of two cases, was caused by a different serogroup C clonal group 1 clone (Figure 1). All clonal group 1 serogroup C strains, including those that caused both outbreaks, belonged to ST-11 (Tables1, 2). Among serogroup C isolates that underwent MLST, the nonclonal group 1 strains were unrelated to ST-11. Among adults >25 years, only 14 serogroup C isolates were available, and therefore, a meaningful trend analysis was not possible.
Figure 2
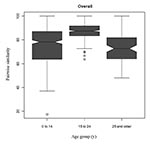
Figure 2. Box-plot of mean pairwise similarities demonstrating the genetic relatedness of serogroup C strains for persons <14 years (32 strains), persons 15–24 years (28 strains), and adults ∃>25 years (14...
In the pairwise similarity analysis, serogroup C infection in those 15–24 years of age was caused by isolates that were more highly genetically related than were serogroup C isolates from other age groups (Table 3 and Figure 2). For example, the median (25th and 75th percentiles) pair-wise similarity during 1992 through 1999 for serogroup C isolates that caused infections in those 15 to 24 years of age was 87.5% (83.3%; 91.7%), in contrast to 78.3% (63.6%, 87.0%) and 72.7% (64.0%, 81.8%) for persons <15 and >25 years of age, respectively (p < 0.01 for the comparisons of those 15–24 years of age versus each of the other two age groups).
Figure 3
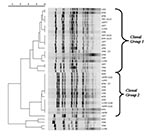
Figure 3. Pulsed-field gel electrophoresis patterns of meningococcal serogroup Y strains isolated from persons >25 years during 1992–1999. Culture date and sequence type are listed to the right of the dendrogram.
Ninety-two percent (70/76) of the serogroup Y isolates were classified into one of two clonal groups (Figure 3). The cophenetic correlation for the serogroup Y dendrogram was 92.3%. The proportion of clonal group 2 serogroup Y strains increased from 7.7% (1/13) in 1992 to 1993; 20.0% (2/10) in 1994 to 1995; 17.9% (5/28) in 1996 to 1997; to 52.0% (13/25) in 1998-99 (p <0.01, exact test for trend). Among adults ∃>25 years of age, clonal group 2 strains increased from 25.0% (1/4) of the case-patients in 1992 to 1993; 33.3% (1/3) in 1994 to 1995; 23.5% (4/17) in 1996 to 1997; and 57.1% (8/14) in 1998 to 1999 (p = 0.28).
Among the 14 serogroup Y isolates on which MLST was performed (Tables 1, 2), clonal group 1 strains belonged to ST 23, ST 1622, or ST 1625, and clonal group 2 belonged to ST 23, ST 1620, and ST 1621. Overall, the serogroup Y clonal group 1 and 2 strains tested belonged to the ST-23 complex. The nonclonal group strains had unrelated STs.
From 1992 to 1997, the increasing incidence of invasive meningococcal disease among persons aged 15–24 years of age was caused primarily by a clonal group of serogroup C strains that belonged to the ST-11 complex. These strains were much more genetically related than the serogroup C isolates, which were causing infection in the two other age groups. In general, ST-11 complex strains belong to the ET-37 complex (7), which has been associated with outbreaks and epidemics (8,14). Although the meningococcal incidence decreased in this age group in the late 1990s, a unique PFGE-defined serogroup C clone that had not been previously detected emerged in 1999. Among patients infected with serogroup Y isolates, a shift from one ST-23 Y clonal group to another occurred over time.
The risk of meningococcal infection depends on a variety of strain, host, and environmental factors (15). During epidemics, which are generally clonal, the proportion of cases that occur in adolescents and young adults often rises, in addition to an increased incidence in other age groups (3). This pattern is believed to be caused, at least in part, by the introduction of a new strain to which the population has little immunity. The increase in adolescents and young adults is similar to the pattern we observed in Maryland, although no epidemic was associated with it. Analogous to the epidemic setting, we hypothesized that the increase in those 15–24 years of age was due to the introduction of a serogroup C clone to which this group had not previously been exposed. We expected the increase to be caused in large part by this new clone, as adolescents and young adults typically otherwise have a low risk for meningococcal infection. This is in contrast to younger children and older adults, who in general are more susceptible to meningococcal infection and therefore might be expected to be infected with a broader range of strains, in addition to the newly introduced clone (2,16).
Although our study had not begun early enough to determine whether clonal group 1 serogroup C strains were truly recently introduced into Maryland, the observation that serogroup C infection in those 15 to 24 years of age was caused by more highly related strains generally supports our hypothesis. The emergence of a new PFGE-defined clone in adolescents in 1999 was somewhat surprising since the meningococcal incidence was decreasing in this age group during that time. The shift from one ST-23 complex serogroup Y clonal group to another during the 1990s may also have been due to the changes in population immunity that occur over time because of the circulation of N. meningitidis in the community. However, since we did not study whether the two clonal groups differed in cell surface immunogens, this hypothesis remains speculative.
The molecular epidemiology of meningococcal infection has historically been determined by MEE (3,15). Recently, however, MLST has been validated as an alternative method to MEE. We found that PFGE further discriminated among strains with the same ET. For example, MLST could not discriminate between the two serogroup C PFGE-defined clones in the 1997 and 1999 outbreaks. This finding was similar to those of a recent study in which meningococcal isolates with the same ET were found to have distinct PFGE patterns (8). Taken together, these data indicate that PFGE and MLST are complementary methods for studies of the molecular epidemiology of N. meningitidis infection (8,13).
In summary, epidemiologic trends in invasive meningococcal disease in Maryland from 1992 to 1999 were associated with specific PFGE-based genotypes of serogroup C and Y strains. Additional studies are needed to determine whether future changes in meningococcal incidence are associated with variations in the strains causing invasive disease.
Dr. McEllistrem is an assistant professor in the Division of Infectious Diseases, Department of Medicine, and a member of the Infectious Diseases Epidemiology Research Unit at the University of Pittsburgh. Her research interests focus on the molecular epidemiology of Streptococcus pneumoniae, Neisseria meningitidis, and Escherichia coli O157:H7.
Acknowledgments
We thank the participating hospital infection control practitioners and microbiology laboratory personnel in Maryland for identifying the meningococcal cases and providing the bacterial isolates; Yvonne Dean Hibbert and Jackie Hunter for assistance in conducting surveillance; Kim Holmes, Alicia Bustamante, and Laurie Sanza for assistance with data collection; Althea Glenn for processing the isolates; Dale Rohn, John Sweitzer, and Jeff Roche and the staff of the Epidemiology and Disease Control Program of the Maryland Department of Health and Mental Hygiene for their support; Susanna Schmink for performing the serogrouping; and Patrick Moore for his thoughtful review of the manuscript.
This study was funded by Aventis Pasteur, the Centers for Disease Control and Prevention, the State of Maryland, and Research Career Awards (K24 AI52788, to L.H. Harrison and K23 AI01788, to M.C. McEllistrem), National Institute of Allergy and Infectious Diseases.
References
- Harrison LH, Pass MA, Mendelsohn AB, Egri M, Rosenstein NE, Bustamante A, Invasive meningococcal disease in adolescents and young adults. JAMA. 2001;286:694–9. DOIPubMedGoogle Scholar
- Rosenstein NE, Perkins BA, Stephens DS, Lefkowitz L, Cartter ML, Danila R, The changing epidemiology of meningococcal disease in the United States, 1992–1996. J Infect Dis. 1999;180:1894–901. DOIPubMedGoogle Scholar
- Diermayer M, Hedberg K, Hoesly F, Fischer M, Perkins B, Reeves M, Epidemic serogroup B meningococcal disease in Oregon: the evolving epidemiology of the ET-5 strain. JAMA. 1999;281:1493–7. DOIPubMedGoogle Scholar
- Peltola H, Kataja JM, Makela PH. Shift in the age-distribution of meningococcal disease as predictor of an epidemic? Lancet. 1982;2:595–7. DOIPubMedGoogle Scholar
- Caugant DA. Population genetics and molecular epidemiology of Neisseria meningitidis. APMIS. 1998;106:505–25. DOIPubMedGoogle Scholar
- Selander RK, Caugant DA, Ochman H, Musser JM, Gilmour MN, Whittam TS. Methods of multilocus enzyme electrophoresis for bacterial population genetics and systematics. Appl Environ Microbiol. 1986;51:873–84.PubMedGoogle Scholar
- Maiden MC, Bygraves JA, Feil E, Morelli G, Russell JE, Urwin R, Multilocus sequence typing: a portable approach to the identification of clones within populations of pathogenic microorganisms. Proc Natl Acad Sci U S A. 1998;95:3140–5. DOIPubMedGoogle Scholar
- Popovic T, Schmink S, Rosenstein NA, Ajello GW, Reeves MW, Plikaytis B, Evaluation of pulsed-field gel electrophoresis in epidemiological investigations of meningococcal disease outbreaks caused by Neisseria meningitidis serogroup C. J Clin Microbiol. 2001;39:75–85. DOIPubMedGoogle Scholar
- Harrison LH, Dwyer DM, Maples CT, Billmann L. Risk of meningococcal infection in college students [published erratum appears in JAMA 2000 May 24–31;283:2659. JAMA. 1999;281:1906–10. DOIPubMedGoogle Scholar
- Schuchat A, Hilger T, Zell E, Farley MM, Reingold A, Harrison L, Active bacterial core surveillance of the emerging infections program network. Emerg Infect Dis. 2001;7:92–9. DOIPubMedGoogle Scholar
- Bygraves JA, Maiden MC. Analysis of the clonal relationships between strains of Neisseria meningitidis by pulsed field gel electrophoresis. J Gen Microbiol. 1992;138:523–31.PubMedGoogle Scholar
- Tenover FC, Arbeit RD, Goering RV, Mickelsen PA, Murray BE, Persing DH, Interpreting chromosomal DNA restriction patterns produced by pulsed- field gel electrophoresis: criteria for bacterial strain typing. J Clin Microbiol. 1995;33:2233–9.PubMedGoogle Scholar
- Finn R, Groves C, Coe M, Pass M, Harrison LH. Cluster of serogroup C meningococcal disease associated with attendance at a party. South Med J. 2001;94:1192–4.PubMedGoogle Scholar
- Popovic T, Sacchi CT, Reeves MW, Whitney AM, Mayer LW, Noble CA, Neisseria meningitidis serogroup W135 isolates associated with the ET-37 complex. Emerg Infect Dis. 2000;6:428–9. DOIPubMedGoogle Scholar
- Moore PS. Meningococcal meningitis in sub-Saharan Africa: a model for the epidemic process. Clin Infect Dis. 1992;14:515–25.PubMedGoogle Scholar
- Stephens DS, Hajjeh RA, Baughman WS, Harvey RC, Wenger JD, Farley MM. Sporadic meningococcal disease in adults: results of a 5-year population-based study. Ann Intern Med. 1995;123:937–40.PubMedGoogle Scholar
Figures
Tables
Cite This ArticleTable of Contents – Volume 10, Number 3—March 2004
| EID Search Options |
|---|
|
|
|
|
|
|
Please use the form below to submit correspondence to the authors or contact them at the following address:
M. Catherine McEllistrem, Infectious Diseases Epidemiology Research Unit, Division of Infectious Diseases, Suite 3A Falk Medical Building, 3601 Fifth Avenue, University of Pittsburgh, Pittsburgh, PA 15213-2582, USA; fax: 412-648-6399
Top