Volume 10, Number 4—April 2004
Research
Restaurant Inspection Scores and Foodborne Disease
Timothy F. Jones* , Boris I. Pavlin†, Bonnie J. LaFleur†, L. Amanda Ingram*, and William Schaffner†
Figure 3
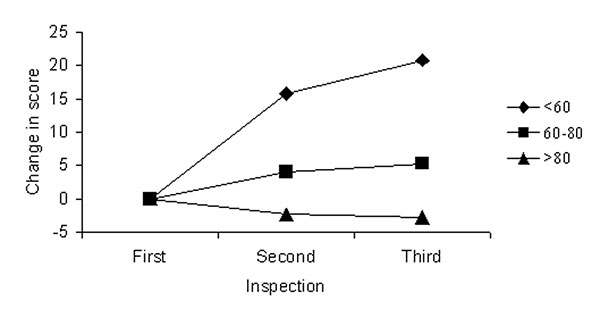
Figure 3. Mean change in scores in subsequent two inspections, for restaurants with an initial score on routine inspection of <60, 60–80, or >80.
Page created: February 09, 2011
Page updated: February 09, 2011
Page reviewed: February 09, 2011
The conclusions, findings, and opinions expressed by authors contributing to this journal do not necessarily reflect the official position of the U.S. Department of Health and Human Services, the Public Health Service, the Centers for Disease Control and Prevention, or the authors' affiliated institutions. Use of trade names is for identification only and does not imply endorsement by any of the groups named above.