Volume 10, Number 5—May 2004
Research
Syndromic Surveillance in Public Health Practice, New York City
Cite This Article
Citation for Media
Abstract
The New York City Department of Health and Mental Hygiene has established a syndromic surveillance system that monitors emergency department visits to detect disease outbreaks early. Routinely collected chief complaint information is transmitted electronically to the health department daily and analyzed for temporal and spatial aberrations. Respiratory, fever, diarrhea, and vomiting are the key syndromes analyzed. Statistically significant aberrations or “signals” are investigated to determine their public health importance. In the first year of operation (November 15, 2001, to November 14, 2002), 2.5 million visits were reported from 39 participating emergency departments, covering an estimated 75% of annual visits. Most signals for the respiratory and fever syndromes (64% and 95%, respectively) occurred during periods of peak influenza A and B activity. Eighty-three percent of the signals for diarrhea and 88% of the signals for vomiting occurred during periods of suspected norovirus and rotavirus transmission.
Two recent phenomena have contributed to widespread interest in monitoring nonspecific health indicator data to detect disease outbreaks early. The first is heightened concern about bioterrorism, particularly the ability of public health agencies to detect a large-scale bioterrorist attack in its early stages. The second is the proliferation of electronic databases in healthcare settings. Initially designed to facilitate billing, health information systems capture an increasingly rich array of clinical detail. Recent advances in information technology make extracting, transmitting, processing, and analyzing these data feasible for public health purposes. The emergency department surveillance system we describe is an early prototype of what may become a standard component of modern public health surveillance.
In New York City, emergency department chief complaint surveillance evolved out of the public health response to the September 11, 2001 World Trade Center attacks (1). When this labor-intensive effort ended, the New York City Department of Health and Mental Hygiene (DOHMH) began intensively recruiting hospitals capable of providing emergency department visit data in electronic formats. We describe the methods and chief results from the first 12 months of experience with this electronic system.
Data Transmission and Processing
Data files are transmitted to DOHMH 7 days per week, either as attachments to electronic mail messages or through direct file transfer protocol (FTP). Half of participating hospitals have automated the transmission process. Data processing and analysis are carried out on a laptop computer that can be operated either through the DOHMH local area network or through remote dial-up, which facilitates weekend and holiday analysis. Each morning, an analyst retrieves the files, inspects them for quality and completeness, and saves them for processing and analysis in SAS (version 8, SAS Institute Inc., Cary, NC). If a file is not received by 10:00 a.m., the analyst contacts hospitals to obtain missing data. The analysis is typically completed by 1 p.m.
Data files contain the following information for all emergency department patient visits logged during the previous midnight-to-midnight 24-hour period: date and time of visit, age in years, sex, home zip code, and free-text chief complaint. Additionally, some hospitals provide either a visit or medical record number. No other personal identifiers are included. Files arrive in several formats, most commonly as fixed-column or delimited ASCII text. Data are read and translated into a standard format, concatenated into a single SAS dataset, verified for completeness and accuracy, and appended to a master archive.
Syndrome Coding
Emergency department patient visits are categorized into exclusive syndromes based on the patient’s chief complaint, a free-text field that captures the patient’s own description of his illness. We developed a SAS algorithm that scans the chief complaint field for character strings assigned to a syndrome. The coding algorithm is designed to capture the wide variety of misspellings and abbreviations in the chief complaint field. If the chief complaint was blank or uninformative (e.g., “EVAL,” “TRIAGE”) the record was omitted. If it contained a word or phrase from a single category it was coded for that syndrome, i.e., “SHORTNESS OF BREATH” or “SOB” appearing alone would indicate the respiratory syndrome. If the chief complaint contained words or phrases from multiple categories, it was coded according to the following hierarchy: common cold > sepsis/dead on arrival > respiratory > diarrhea > fever > rash > asthma > vomiting > other visits. The hierarchy attempts to place each chief complaint into a single, specific syndrome (Table 1). Chief complaints containing text strings such as, “cold,” “sneeze,” “stuffy,” or “nasal” are coded as cold and excluded to increase the specificity of the respiratory category for illnesses other than viral rhinitis. The two syndromes of particular interest for bioterrorism surveillance are the respiratory and fever syndromes in persons >13 years of age. Children are excluded due to their high rates of febrile and respiratory illnesses and to limit the number of false signals generated. Respiratory and fever syndromes in children are examined by graphic and CUSUM analyses with SaTScan performed on an ad hoc basis. We monitor the diarrhea and vomiting syndromes in all ages in an effort to detect gastrointestinal outbreaks that may be due to contamination of food or water.
Statistical Methods
Separate analyses are carried out for each syndrome-age category of interest to look for citywide temporal increases and clustering by either hospital location or patient’s home zip code. The intent of the system is to detect moderate- to large-scale events and not single cases. The term “signal” hereafter refers to a statistically significant aberration (2).
Citywide Temporal Analysis
The primary method for evaluating citywide trends in syndrome visits is an adaptation of the one-dimensional temporal scan statistic (3–5) to a prospective setting with daily analyses and a variable-length window consisting of the last 1, 2, or 3 days. This adaptation is a special case of the prospective space-time scan statistic (6). The ratio of syndrome visits to nonsyndrome (other) visits during the most recent 1, 2, or 3 days is compared to a 2-week baseline. The choice of a maximum window length is flexible. We set this length to 3 days to be able to detect sharp 1-day spikes as well as more gradual increases over 2 or 3 days. Using SaTScan version 2.1.3 (7), we calculate a likelihood ratio statistic that reflects the difference between the observed data and what would be expected under the null hypothesis (no temporal trend). Significance of citywide signals is derived through Monte Carlo hypothesis testing by ranking these likelihoods within a distribution of similarly calculated likelihood ratios from 999 random datasets. Our p values are adjusted for the multiple comparisons inherent in both the multiple window lengths evaluated as well as for running daily prospective analyses (6).
Spatial Clustering Analysis
The spatial scan statistic (7), originally developed for the retrospective analyses of chronic diseases, has been adapted for infectious disease surveillance (8). This approach requires comparing the observed to the expected number of cases in each geographic area. In cancer epidemiology, the expected cases can be well-approximated by using the underlying (age-adjusted) population, but this approach cannot detect infectious disease outbreaks when using healthcare utilization data, as higher rates of illness and emergency-department utilization in some areas of the city are found at baseline. To control for these purely spatial differences, expected counts of syndrome visits are derived from each area’s history, rather than from the underlying census population. Since rapidly emerging outbreaks are of particular interest, we take the data from the observed cases from the last day and compare them with data from a 14-day baseline period, ending 2 days earlier (i.e., a 1-day gap is left between the baseline and the date on which spatial clustering is being evaluated). The expected number of visits in a geographic area is calculated as follows:
where T is the total visits in the geographic area on the date being evaluated, Scity and Tcity are the number of syndrome and total visits citywide on this date, Sbaseline and Tbaseline are the number of syndrome and total visits in the geographic area during the 14-day baseline, and Scity baseline and Tcity baseline are the corresponding citywide numbers.
For both the citywide temporal and spatial clustering analyses, the most likely cluster for the observed dataset is determined by using the SaTScan software on the basis of the likelihood

where O is the observed count for the syndrome and E is the expected count. Significance is derived from ranking this likelihood ratio among 999 randomized datasets by using Monte Carlo simulations. A significant signal is defined by a p value < 0.01, so that for each syndrome we would expect, on average, one false signal every 100 days. This threshold set the frequency of signal investigations at a sustainable level.
Dissemination of Results
Each day’s analyses are reviewed with a medical epidemiologist, and a report consisting of graphs and a brief summary is distributed by electronic mail to program staff. If a signal investigation is performed, a more detailed report is prepared and made available by the next day. An external report summarizing citywide trends is also distributed daily to state and regional health officials, the New York City (NYC) Office of Emergency Management, police departments, and fire departments. Hospital-specific, confidential reports are shared quarterly with participating emergency departments, comparing their facility to overall citywide trends.
Signal Response
The investigation of a spatial syndromic signal begins with descriptive review of the emergency department visits included in the signal. Syndrome observed and expected values by hospital are reviewed to focus the investigation at the hospital(s) contributing the largest number of excess cases. A line list of patients with their chief complaints is produced, along with summary statistics for age, sex, and zip code. Chief complaints that are wrongly coded, such as “denies fever” coded as fever syndrome, are noted, and the coding algorithm is amended. For a subset of emergency departments, an electronic or paper interim chief complaint log covering visits since midnight can be obtained to determine whether the number of syndrome visits remains elevated. Phone calls are made to emergency department and other hospital staff to alert them to unusual disease patterns and to ask whether they have noted an increase in the frequency of syndrome visits or admission of seriously ill patients. Signals of continuing concern are further investigated by field staff conducting chart reviews, patient interviews, and onsite discussions with clinicians.
During the surveillance period (November 15, 2001, to November 14, 2002), 2.5 million patient visits were recorded from 39 participating emergency departments. The citywide average number of visits was 6,780/day (mean per emergency department = 174; range 36–460).
The median daily proportion of emergency departments that transmitted data in time for analysis was 95%. This proportion ranged from 63% on a day when the central electronic mail system for 11 public hospitals was inoperable to 100% on 104 of the 365 surveillance days. Timeliness of reporting was higher for the 21 hospitals that used automated data transmission (median 100% reported on time) than for the 18 hospitals that relied on manual transmission (median 81% reported on time; Wilcoxon test p < 0.001). Data were also more complete on weekdays (median 97% reported on time) than on weekends and holidays (median 86%, Wilcoxon test p < 0.001).
The chief complaint field was blank or uninformative in 4.1% of records. The proportion of visits with missing or uninformative chief complaint did not vary significantly by age, sex, or day of week but was concentrated at nine emergency departments where from 11% to 30% of records had missing or uninformative chief complaint each day. Among records with chief complaints, 0.3% were missing age, and 2.0% were missing zip code.
Table 2 shows the distribution, by syndrome category, of the 2,374,131 (96%) emergency department visits for which chief complaint was informative. Marked differences were found in the distribution of chief complaints by age. The key syndromes (respiratory, fever, diarrhea, and vomiting) accounted for 42% of visits among children age <12 years compared to only 12% among those >13 years of age.
Citywide Signals
Respiratory and Fever Syndromes
Figure 1
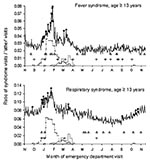
Figure 1. Trends in emergency department visits for fever and respiratory syndromes, New York City, November 1, 2001–November 14, 2002. Plots show the daily ratio of syndrome visits to other (noninfectious disease) visits....
A citywide signal in the respiratory syndrome was first detected on December 25, 2001, and citywide signals for both fever and respiratory syndromes occurred over the following 6 days. This signal provided the earliest indication of communitywide influenza activity in New York City for the 2001–02 season (Figure 1). This series of signals began 2 weeks before increases in positive influenza laboratory isolates were noted and 3 weeks before sentinel physician increases in influenzalike illness were reported. Retrospectively, these emergency department signals coincided by illness onset date with a sharp increase in positive laboratory tests for influenza A (Figure 1).
Overall, 14 (64%) of 22 citywide respiratory signals and 21 (95%) of 22 citywide fever signals occurred during periods of peak influenza A and B activity. Three other respiratory signals—an isolated signal in late November 2001 and a pair of signals in September 2002—coincided with an increase in asthma visits, and a series of five signals in October 2002 occurred during a period of steadily increasing respiratory visits. Only one isolated fever signal occurred outside of the influenza season, during August 2002.
Diarrhea and Vomiting Syndromes
Figure 2
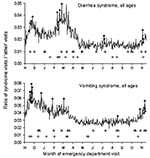
Figure 2. Trends in emergency department visits for diarrhea and vomiting syndromes, New York City, November 1, 2001–November 14, 2002. Plots show the daily ratio of syndrome visits to other (noninfectious disease) visits....
Diarrhea and vomiting signals occurred during three periods of communitywide gastrointestinal illness activity. In November 2001, we observed sharp increases in emergency department visits and repeated signals for diarrhea and vomiting syndrome among both children and adults (Figure 2). Concurrently, DOHMH received reports of institutional outbreaks whose characteristics were consistent with norovirus. In one instance, a calicivirus was isolated. A second major increase in gastrointestinal illness occurred during February and March of 2002 and was most pronounced among children under age 5 with diarrhea. Local hospital-based virology laboratories were queried and reported an increase in requests for rotavirus tests and positive results. Finally, a series of diarrhea and vomiting signals was again noted in November 2002 before widespread reports of institutional outbreaks. During the ensuing 6 weeks, norovirus was identified in stool specimens from 3 (75%) of 4 emergency department patients and 18 (69%) of 26 persons identified through five separate outbreak investigations.
Overall, 15 (83%) of 18 diarrhea signals and 21 (88%) of 24 vomiting signals occurred during these three outbreak periods. Three additional isolated vomiting signals and one series of three consecutive diarrhea signals of unknown cause occurred in July 2002.
Spatial Signals
Respiratory and Fever Syndromes
A total of 25 hospital-based respiratory or fever signals and 18 zip code–based signals occurred during the 12-month period, in which we would have expected only 7 (730 analyses-days x 0.01, Table 3). The number of respiratory and fever spatial signals occurring in October 2001 through March 2002 (when the citywide incidence of respiratory and fever visits was higher), 21 signals/183 surveillance days, was no different than the number occurring during the rest of the year (22 signals/182 surveillance days, χ2 p = 0.9). No spatial signal persisted for >1 day in the same area. Investigations of these spatial signals showed no sustained increase in visits and no illnesses indicating bioterrorism. No localized natural outbreaks were detected, although few diagnostic specimens were collected and tested in response to spatial signals. No large respiratory outbreaks were reported through traditional surveillance during this period.
Diarrhea and Vomiting Syndromes
A total of 34 hospital-based diarrhea or vomiting signals and 21 zip code–based signals were found during the 12-month period (Table 2). Signals occurred more frequently between mid-October and mid-April when citywide incidence of gastrointestinal illness was high (36 signals/183 surveillance days) compared to the rest of the year (19 signals/182 surveillance days, χ2 p = 0.02). Several moderate- to large-sized institutional gastrointestinal outbreaks were reported to the DOHMH but not detected through syndromic surveillance. One reported gastrointestinal outbreak involved schoolchildren, who went to a nonparticipating hospital’s emergency department. Retrospective review of data from this outbreak showed that it would have been detected had this hospital participated during that period.
In its first year of operation, the emergency department syndromic system identified communitywide increases in gastrointestinal illness in all ages consistent with norovirus (9), an increase in diarrheal illness among young children consistent with rotavirus, and the arrival of epidemic influenza. DOHMH used this information to alert the medical community of the arrival of these pathogens, something it had not been able do in a timely fashion previously. The system also detected many single-day spatial signals suggestive of illness clusters; however, none of these signals were verified as outbreaks. Several foodborne and institutional gastrointestinal outbreaks occurred in New York City during the surveillance period and were not identified by our emergency department surveillance system. None of the other outbreaks reported through traditional means during this period gave a simultaneous syndromic signal, and unreported outbreaks were probably likewise missed. A major limiting factor of syndromic surveillance using emergency visits for mild or prodromal illness is that adults with gastroenteritis or mild respiratory symptoms usually do not seek medical care in emergency departments.
The operational strengths of the emergency department syndromic surveillance system we describe include its ease of initial setup and relatively low cost of maintenance (direct DOHMH costs estimated at $130,000 per year for 40 hospitals and population >8,000,000). Cooperation from hospital staff aided this effort considerably. Forty-five hospitals in New York City, covering an estimated 80% of emergency department visits, currently participate in the surveillance system. Achieving fully automated, standardized, and encrypted data transmission has been a slow process but remains a priority.
Public health authorities in general (10) and the New York City DOHMH in particular (11) have a legal mandate to conduct surveillance for outbreaks and are covered by specific provisions in the Health Insurance Portability and Accountability Act. However, good public health practice requires that steps be taken to minimize the privacy risk to persons and institutions. These steps include collecting the minimum amount of identifiable data necessary (e.g., age rather than date of birth), encrypted data transfer, and protocols for limiting access to potentially identifiable information.
One key attribute of syndromic surveillance systems is timeliness. We selected chief complaint for categorizing emergency department visits into syndromes because it is available in electronic format within hours of the patient’s arrival. The accuracy of chief complaint as an indicator of patient illness has been evaluated and was shown in one study to have good agreement for the syndromes of respiratory and gastrointestinal illness (12) and in another study to be equally sensitive and specific as discharge diagnosis for acute respiratory illness (13). Both studies used coding algorithms that differ from those of DOHMH as well as each from each other. Standardization of coding algorithms would facilitate comparing system results. CDC, the Department of Defense Global Emerging Infections System, and representatives of model systems have created ICD9-based standard syndromes that may serve as a template for chief complaint coding (14).
The desire to quickly detect outbreaks (especially those due to bioterrorism) has also influenced our approach to aberration detection algorithms. The methods we have adapted are designed to detect increases in syndromes that occur within 1 to 3 days, rather than provide greatest sensitivity for detecting outbreaks that have been building for a week or more (15). Debate exists on whether a bioterrorist attack would be first detected by an astute clinician diagnosing severe illness or by syndromic surveillance detecting focal or widespread prodromal illness. Our system has thus far not detected a localized outbreak, and whether the spatial clusters represent true localized outbreaks, statistical noise, or clustering due to other causes remains unknown. Answering this question will require accumulated experience with true localized outbreaks, more intensive investigation of spatial signals, or simulation studies with outbreak scenarios and “spiked” datasets.
Some critics have highlighted the challenges of investigating syndromic signals while preserving the advantage of time they afford (16). Analytic methods and investigation protocols must be designed so they do not overburden public health agencies. Our experience suggests several lessons in this regard: 1) the number of syndromes and analyses used increases the number of signals that need to be evaluated, 2) determining the signal threshold is as much operational as statistical: thresholds must be set at a sustainable level for public health investigation and reflect changing levels of concern for outbreaks, and 3) sustained geographic signals are rare. A stepwise approach to field investigations is a practical way of limiting the costs and burden of the system.
The NYC DOHMH system is unique in that the operational, response, and research components are integrated within a health department. The staff members who analyze data are the same as or work closely with those who perform signal investigations. Knowledge of the data and system operational aspects is invaluable for understanding signals and following up with emergency departments.
Surveillance systems that use existing electronic data can provide timely information about the health of the population at low cost and with minimal effort on the part of data providers. Our syndromic surveillance system has helped detect communitywide outbreaks and reassure the public during high-profile public events. It can be readily adapted to other uses, and we have explored this potential by tracking emergency department visits for asthma, dog bites, heat-related illness, suicide, and drug overdoses. We have used the system to find cases of rash illness, measles, anthrax powder hoaxes, putative spider bites, and botulismlike illness. Nevertheless, syndromic surveillance systems are essentially “smoke detectors” and call for prompt investigation and response if they are to provide early warning of outbreaks. Syndromic surveillance should be viewed as an adjunct to, not a replacement of, traditional disease surveillance. For many, if not all, state and local public health departments, the emphasis of bioterrorism preparation should be on hiring well-trained public health professionals with responsibilities beyond bioterrorism.
Mr. Heffernan is director of the Syndromic Surveillance and Analytical Unit of the Bureau of Communicable Disease for the New York City Department of Health and Mental Hygiene. His interests include pneumococcal disease, infectious disease surveillance, and analytical methods.
Acknowledgment
We thank the medical and information technology staff of participating New York City emergency departments and the Department of Health and Mental Hygeine Syndromic Surveillance Team: Joel Ackelsberg, Sharon Balter, Melanie Besculides, Jane Greenko, Jessica Hartman, Deborah Kapell, Marcelle Layton, Jennifer Leng, Kristi Metzger, Michael Phillips, Vasudha Reddy, Carla Rodriguez, Richard Rosselli, Linda Steiner, and Polly Thomas.
References
- Das D, Weiss D, Mostashari F, Treadwell T, McQuiston J, Hutwagner L, Enhanced drop-in syndromic surveillance in New York City following September 11, 2001. J Urban Health. 2003;80(Suppl 1):i76–88.PubMedGoogle Scholar
- Wagner MM, Tsui FC, Espino JU, Dato VM, Sittig DF, Caruana RA, The emerging science of very early detection of disease outbreaks. J Public Health Manag Pract. 2001;7:51–9.PubMedGoogle Scholar
- Wallenstein S. A test for detection of clustering over time. Am J Epidemiol. 1980;111:367–72.PubMedGoogle Scholar
- Naus J. The distribution of the size of the maximum cluster of points on a line. J Am Stat Assoc. 1965;60:532–8. DOIGoogle Scholar
- Weinstock MA. A generalized scan statistic test for the detection of clusters. Int J Epidemiol. 1981;10:289–93. DOIPubMedGoogle Scholar
- Kulldorff M. Prospective time periodic geographic disease surveillance using a scan statistic. [Ser A]. JR Stat Soc. 2001;164:61–72.
- Kulldorff M, Rand K, Gherman G, Williams W, DeFrancesco D. SaTScan v2.1: software for the spatial and space-time scan statistics. Bethesda (MD): National Cancer Institute; 1998.
- Mostashari F, Kulldorff M, Hartman JJ, Miller JR, Kulasekera V. Dead bird clusters as an early warning system for West Nile virus activity. Emerg Infect Dis. 2003;9:641–6.PubMedGoogle Scholar
- Centers for Disease Control and Prevention. Norovirus activity—United States. MMWR Morb Mortal Wkly Rep. 2003;52:41–5.PubMedGoogle Scholar
- Broome CV, Horton HH, Tress D, Lucido SJ, Koo D. J Urban Health. 2003;80(Suppl 1):i14–22. DOIPubMedGoogle Scholar
- Lopez W. New York City and state legal authorities related to syndromic surveillance. J Urban Health. 2003;80(Suppl 1):i23–4.PubMedGoogle Scholar
- Begier EM, Socwell D, Branch LM, Davies-Cole JO, Jones LH, Edwards L, The National Capitol Region’s emergency department syndromic surveillance system: do chief complaint and discharge diagnosis yield different results? Emerg Infect Dis. 2003;9:393–6.PubMedGoogle Scholar
- Epsino JU, Wagner MM. Accuracy of ICD-9-coded chief complaints and diagnoses for the detection of acute respiratory illness. Proceedings of the Annual Symposium/American Medical Informatics Association; 2001 Nov 3–7; Washington, DC. Hanley and Belfus: p. 164–8.
- Centers for Disease Control and Prevention. Syndrome definitions for diseases associated with critical bioterrorism-associated agents [monograph on the Internet]. 2003 Oct 23 [cited 2003 Nov]. Available from: http://www.bt.cdc.gov/surveillance/syndromedef/index.asp
- Reis B, Mandl K. Time series modeling for syndromic surveillance. BMC Med Inform Decis Mak. 2003;3:2. DOIPubMedGoogle Scholar
- Reingold A. If syndromic surveillance is the answer, what is the question? [serial on the Internet]. Biosecur Bioterror. 2003; (
May ):1 Available from http://www.biosecurityjournal.com/PDFs/v1n203/p77_s.pdf.PubMedGoogle Scholar
Figures
Tables
Cite This ArticleTable of Contents – Volume 10, Number 5—May 2004
| EID Search Options |
|---|
|
|
|
|
|
|
Please use the form below to submit correspondence to the authors or contact them at the following address:
Don Weiss, Bureau of Communicable Disease, New York City Department of Health and Mental Hygiene, 125 Worth St., Box 22A, New York, NY 10013, USA; fax 212-676-6091
Top