Volume 11, Number 10—October 2005
Research
Pyrosequencing Bacillus anthracis
Figure

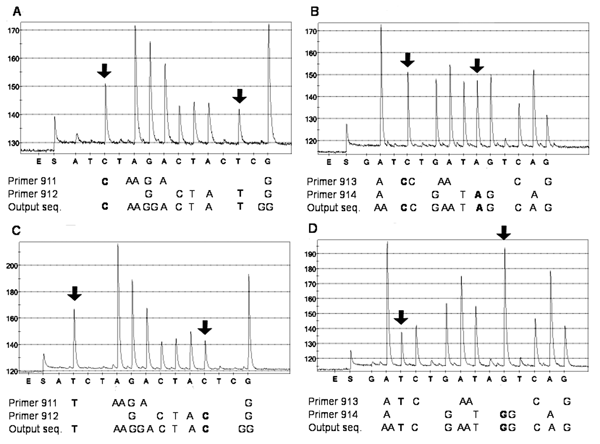
Figure. Sequence analysis of single nucleotide polymorphisms (SNPs) in the rpoB gene of Bacillus anthracis National Collection of Type Cultures (NCTC) 2026 (A and B) and B. cereus Culture Collection University of Gothenburg (CCUG) 7414 (C and D). The initial addition of enzyme (E) and substrate (S) mixture and the sequential addition of nucleotides are shown on the x axis. An initial peak was generated when the substrate mixture was added due to pyrophosphate molecules remaining from the polymerase chain reaction (PCR) reaction. Incorporation of added nucleotides was detected as light peaks, measured in relative light units as shown on the y axis. Incorporation of 2 identical consecutive nucleotides gave rise to peaks that were higher than those generated when a single nucleotide was incorporated. The 4 SNPs were determined by using the 4 sequencing primers 911–914 in 2 duplex reactions per strain. The output sequence reported by the software was a combination of the 2 unique sequences produced by each primer in the duplex reactions. The SNPs distinguishing B. anthracis NCTC 2026 from B. cereus CCUG 7414 are shown in bold.