Volume 11, Number 7—July 2005
Dispatch
Nosocomial Malaria and Saline Flush
Figure A1

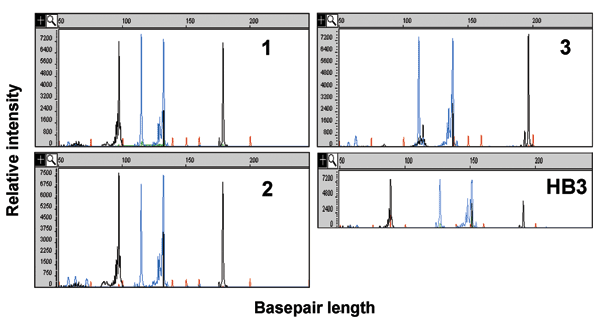
Figure A1. . Capillary electropherograms of Plasmodium microsatellite analysis. The x axis represents fragment size in bases and the y axis represents fluorescence intensity. The P. falciparum microsatellites products C13M30 and PFPK (black peaks) and TA81 and C4M8 (blue peaks) from amplification genomic DNA from patients 1, 2, one of the unrelated patient controls, and control P. falciparum clone HB3. Each microsatellite has ≥10 alleles. Patients 1 and 2 have identical microsatellites at all 4 loci (Table).
Page created: April 24, 2012
Page updated: April 24, 2012
Page reviewed: April 24, 2012
The conclusions, findings, and opinions expressed by authors contributing to this journal do not necessarily reflect the official position of the U.S. Department of Health and Human Services, the Public Health Service, the Centers for Disease Control and Prevention, or the authors' affiliated institutions. Use of trade names is for identification only and does not imply endorsement by any of the groups named above.