Volume 11, Number 9—September 2005
Research
Dead Crow Density and West Nile Virus Monitoring, New York
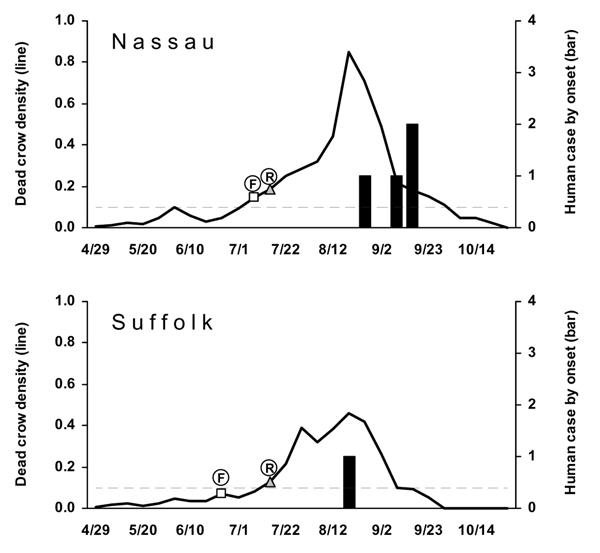
Figure 2

Figure 2. . Dead crow densities (DCD, dead crows per square mile) and number of cases of human West Nile virus (WNV) disease, by week, 2001. Horizontal dashed line indicates DCD = 0.1. F, date that the first bird with confirmed WNV infection was found; R, date that the laboratory result of the first bird with WNV infection was reported.
Page created: April 23, 2012
Page updated: April 23, 2012
Page reviewed: April 23, 2012
The conclusions, findings, and opinions expressed by authors contributing to this journal do not necessarily reflect the official position of the U.S. Department of Health and Human Services, the Public Health Service, the Centers for Disease Control and Prevention, or the authors' affiliated institutions. Use of trade names is for identification only and does not imply endorsement by any of the groups named above.