Volume 11, Number 9—September 2005
Synopsis
Achieving Operational Hydrologic Monitoring of Mosquitoborne Disease
Jeffrey Shaman* and Jonathan F. Day†
Figure 1
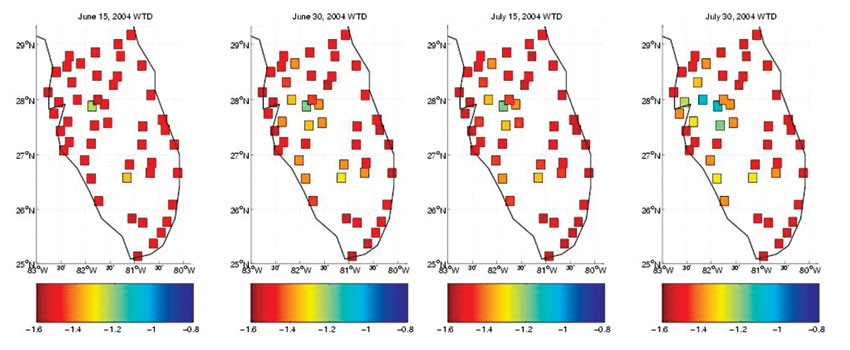
Figure 1. . Map of early summer 2004 hydrologic conditions as modeled with the topographically based hydrology model at 49 sites throughout south Florida. Daily averaged conditions are shown for June 15, June 30, July 15, and July 30, 2004. Red shades indicate drier soil conditions, which support less surface pooling; blue shades indicate wetter conditions.
Page created: April 23, 2012
Page updated: April 23, 2012
Page reviewed: April 23, 2012
The conclusions, findings, and opinions expressed by authors contributing to this journal do not necessarily reflect the official position of the U.S. Department of Health and Human Services, the Public Health Service, the Centers for Disease Control and Prevention, or the authors' affiliated institutions. Use of trade names is for identification only and does not imply endorsement by any of the groups named above.