Volume 12, Number 3—March 2006
Research
West Nile Virus Infections Projected from Blood Donor Screening Data, United States, 2003
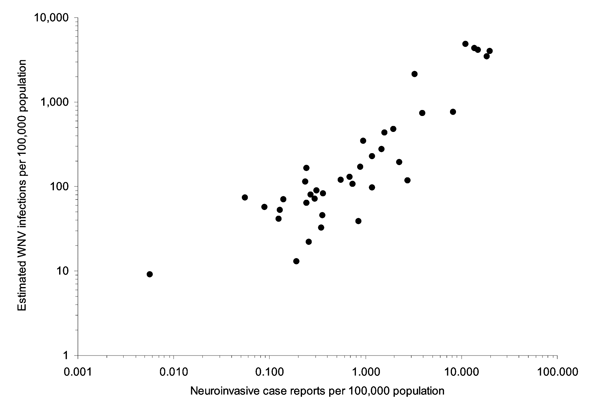
Figure 5

Figure 5. Projected proportion of each state's population infected with West Nile virus versus the proportion of the state's population reporting neuroinvasive disease cases to the Centers for Disease Control and Prevention's ArboNET program. Data are excluded for 13 states: 6 states with neither minipool–nucleic acid amplification testing (MP-NAP) yield nor neuroinvasive cases, 6 states with 2 to 12 neuroinvasive cases but no MP-NAT yield, and 1 state with 1 MP-NAT–positive donor but no reported neuroinvasive cases.
Page created: January 27, 2012
Page updated: January 27, 2012
Page reviewed: January 27, 2012
The conclusions, findings, and opinions expressed by authors contributing to this journal do not necessarily reflect the official position of the U.S. Department of Health and Human Services, the Public Health Service, the Centers for Disease Control and Prevention, or the authors' affiliated institutions. Use of trade names is for identification only and does not imply endorsement by any of the groups named above.